How to choose, what to use, and how to turn dashboards into real revenue
If you’re here, you’re probably in one of these situations:
- You’re drowning in disconnected reports and spreadsheets.
- You know you should be “data-driven” but don’t know which tools to choose.
- Your boss or clients keep asking: “So… which campaigns are actually working?”
The good news: you don’t need 20 tools and a full data team to get clarity.
▶️ In this guide from The Rank Masters, you’ll discover:
- What marketing analytics tools actually do
- The main types of tools you need (not just random logos)
- The best tools in each category
- How to choose a stack that fits your stage and budget
- Real-world analytics stacks you can copy
- A simple implementation roadmap to turn data into growth
Let’s turn your marketing from guesswork into a growth system.
💡 Key Takeaways
- You don’t need 15 tools, you need a focused stack that works together: GA4 or Matomo for core tracking, GSC + Ahrefs/Semrush for SEO, Mixpanel/Amplitude for product insights, Looker Studio + Supermetrics for reporting, and HubSpot/Klaviyo for lifecycle and revenue analytics.
- Start with foundations (accurate tracking + clear dashboards) before adding advanced tools; bad data plus fancy software is still bad data.
- Choose tools based on your stage and model: lean stack for early-stage, deeper product analytics and lifecycle tools as you grow, and BI/warehouse when you’re truly data-mature.
- In the AI era, your tools’ biggest job is to create clean, connected, first-party data that AI and analytics can actually learn from.
- The winning teams aren’t the ones with the most tools, they’re the ones who can clearly answer:
“Which channels, campaigns, and product experiences are driving profitable, compounding growth?”
Table of Contents
Let’s look at widely used tools that work well for real businesses. We’ll keep it practical: what they’re best for, why they matter, and when to pick them.
Here’s a short, skimmable summary of the main tools and what they’re best for 👇
- GA4 (Google Analytics 4)Best for: Core website & app analytics, conversion tracking, basic funnels (all stages).
- Mixpanel / AmplitudeBest for: Product analytics—tracking in-app behaviour, activation, retention, and feature adoption.
- Matomo
Best for: Privacy-focused web analytics with full data ownership
- Google Search Console (GSC)Best for: SEO performance, keyword queries, indexing issues, organic traffic insights.
- Ahrefs / SemrushBest for: Keyword research, backlink analysis, competitor SEO, content planning.
- Looker StudioBest for: Free, flexible dashboards that combine data from multiple sources.
- SupermetricsBest for: Pulling ad + marketing data into sheets, warehouses, or dashboards at scale.
- HubSpotBest for: B2B/SaaS CRM + marketing + sales analytics across the full lead → deal → customer journey.
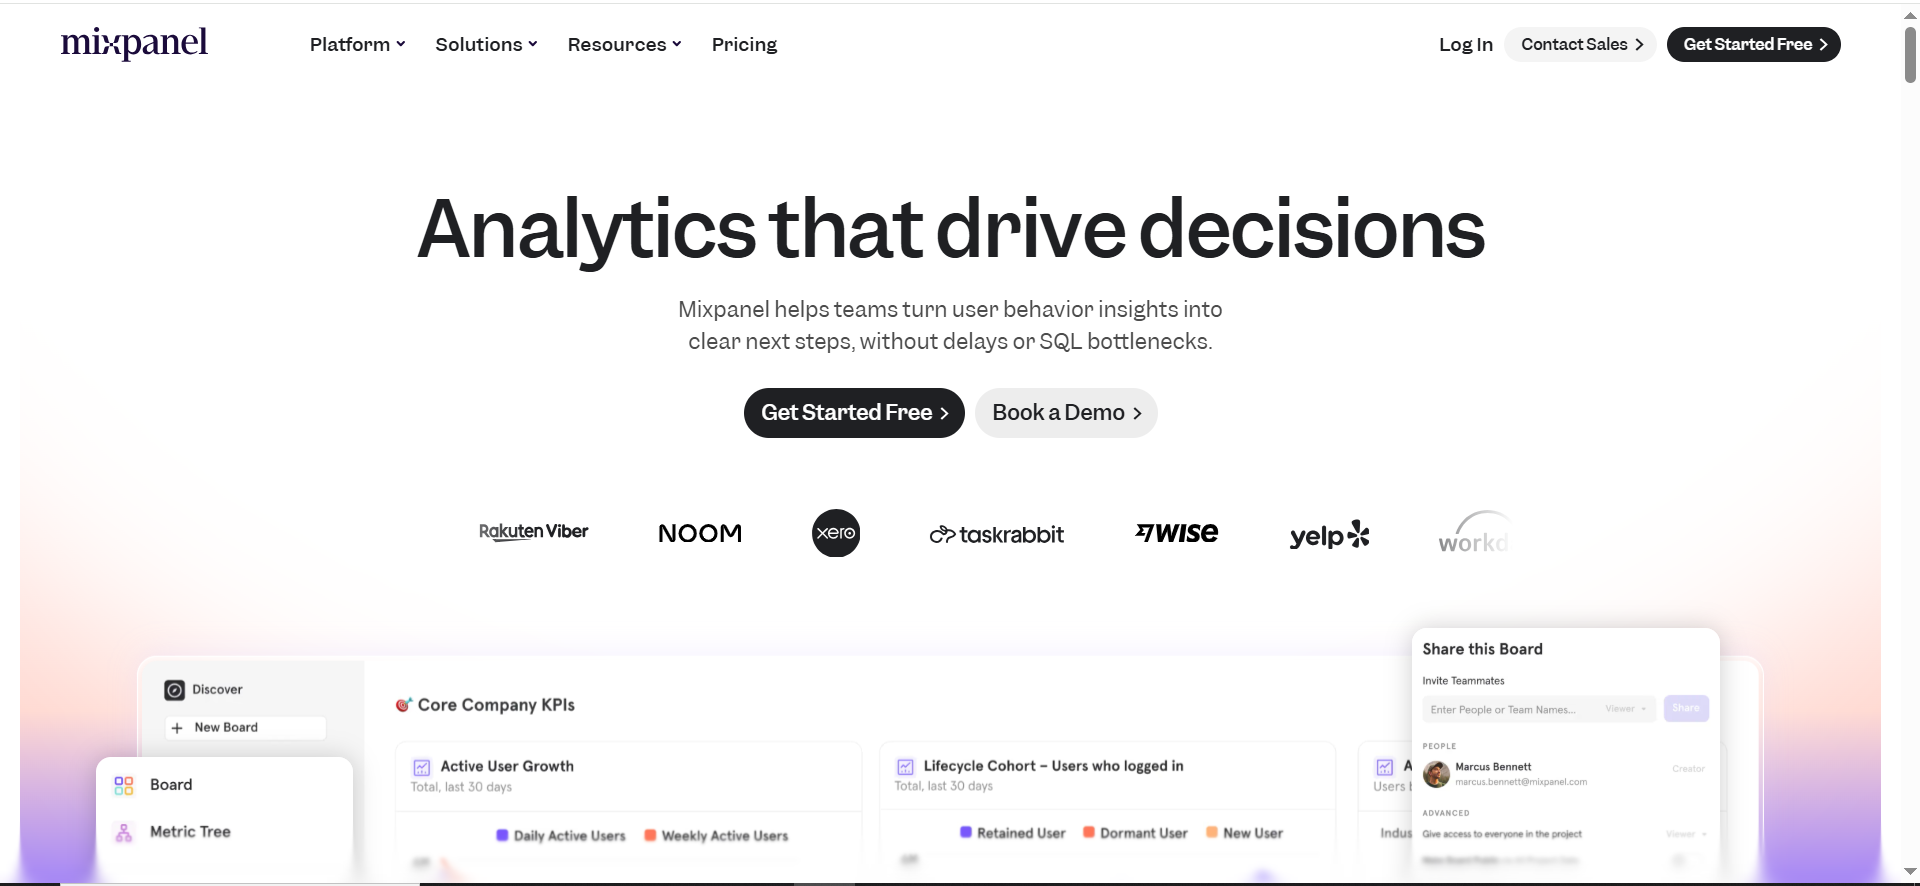
1️⃣ Google Analytics 4 (GA4)
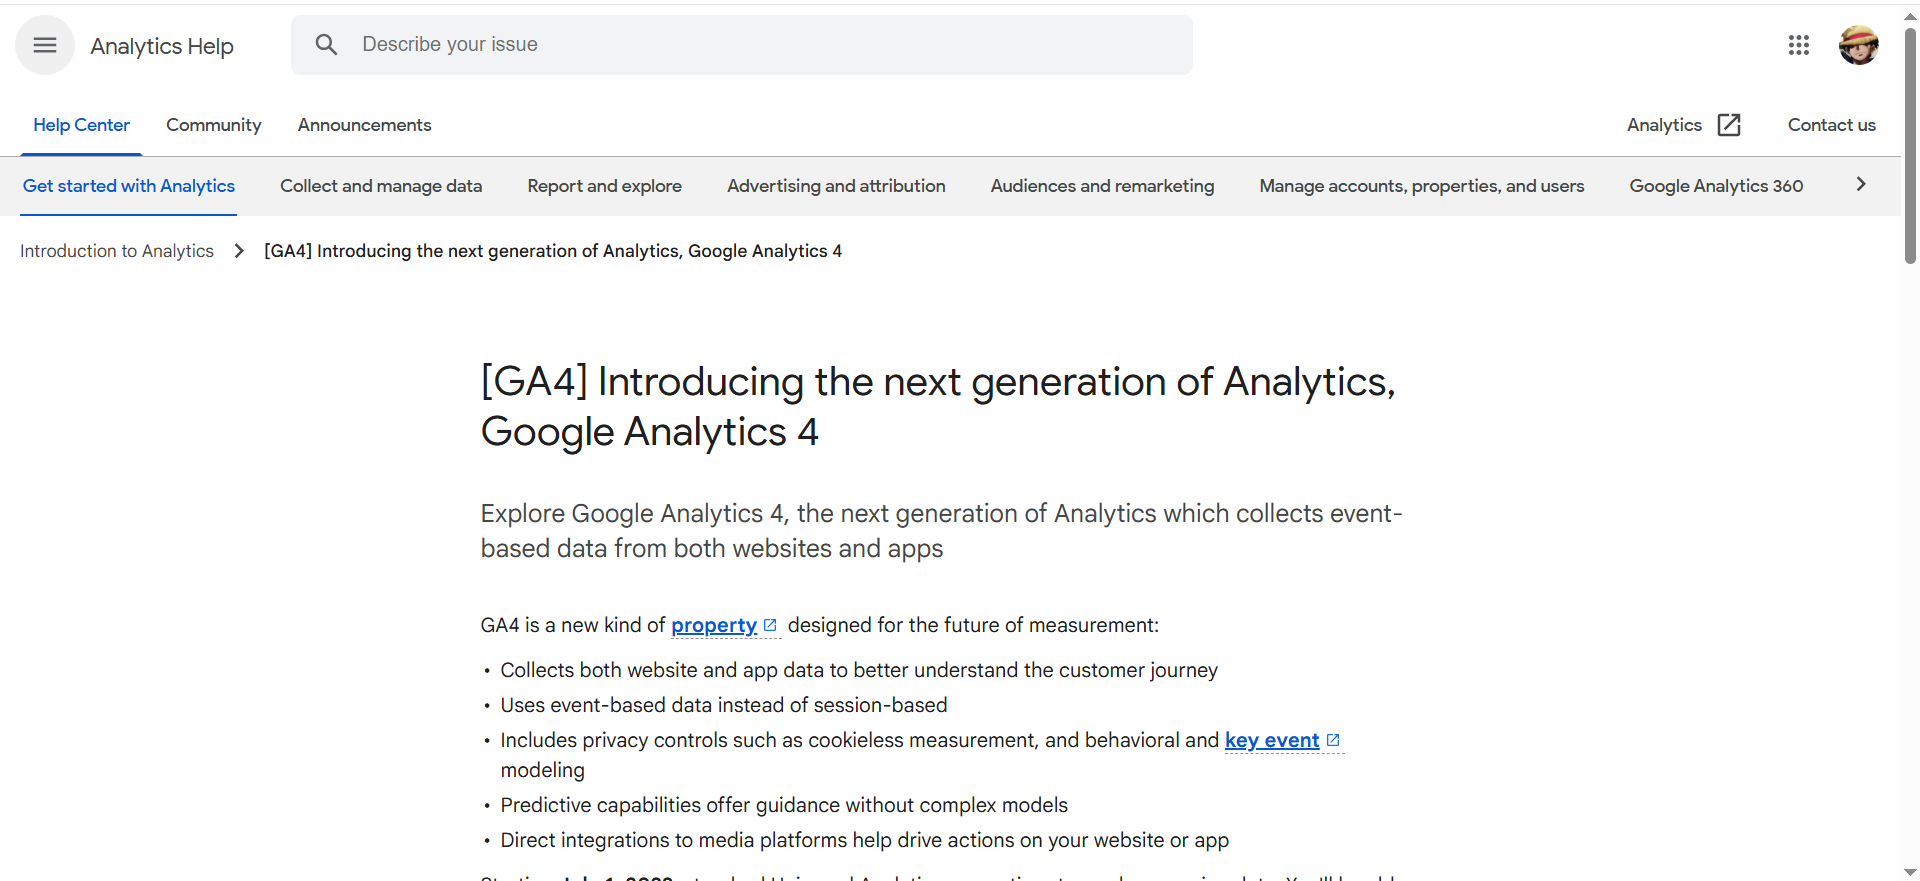
What it does?
Google Analytics 4 is Google’s free, event-based analytics platform for websites and apps. It tracks where users come from, what they do on your site or app, and which actions lead to conversions or revenue. GA4 unifies data across devices and platforms, supports funnel and path analysis, and integrates deeply with other Google products.
Why teams use it?
Teams use GA4 as their default “source of truth” for traffic and conversion metrics. It’s free, powerful enough for most businesses, and recognised by almost every marketer and developer. Because it plugs into Google Ads, BigQuery, and Looker Studio, it becomes the backbone for both performance optimisation and reporting.
Who is this tool for (ICP)?
GA4 is a fit if you:
- Run a website or app and want core analytics without licence fees
- Invest in performance marketing, especially Google Ads & YouTube
- Are a startup, SMB, or agency needing a standardised analytics setup
- Have at least minimal technical support for implementation
How this tool fits in this AI-first era?
GA4 provides event-level, first-party data that feeds AI models, attribution and forecasting. It’s often the main behavioural dataset your AI tools rely on.
- Feeds data into AI-powered bid strategies and audiences
- Enables predictive metrics (e.g., purchase propensity) that AI can optimise against
- Integrates with warehouses/BI where AI copilots and agents run
How does Google Analytics 4 work?
You add GA4 tracking (via gtag.js or Google Tag Manager, or an SDK for apps). User actions are tracked as events with parameters, which GA4 aggregates into reports, funnels, paths, and audiences. You can then explore this data in the GA4 UI or export it to BigQuery for deeper analysis.
Free tier?
Yes (GA4 standard is free; GA4 360 is paid/enterprise).
Strengths?
- Free and powerful for most small–mid businesses
- Deep integrations across the Google ecosystem
- Event model is flexible for advanced setups
Weaknesses?
- Steep learning curve and non-intuitive UI for beginners
- Sampling and data limits on the free tier
- Some organisations have privacy/regulatory concerns
Key Capabilities?
GA4 covers most foundational analytics needs.
- Event-based web & app tracking with funnels and paths
- Conversion & attribution reporting across channels
- Audience building and export to ad platforms
- BigQuery export for advanced modelling
Pricing snapshot?
- GA4 Standard: $0 (free)
- GA4 360: Enterprise, contact sales (commonly cited starting around $50,000+/year via resellers)
Best for?
GA4 is best for teams that want a robust, cost-effective analytics foundation and already use the Google stack. It’s ideal as a default analytics layer for most websites and as a feed into more advanced AI/BI systems as you mature.
Rating
2️⃣ Mixpanel / Amplitude (Product Analytics)
What it does?
Mixpanel and Amplitude are event-based product analytics tools that focus on in-app behaviour, feature usage, and retention. They track every meaningful action a user takes, then visualise funnels, cohorts, flows, and retention curves. They go far beyond pageviews and give teams visibility into the full product journey.
Why teams use it?
Teams use these tools to understand which features drive activation, engagement, and long-term retention. They help quantify product-led growth, not just marketing-driven signups. Growth and product teams rely on them to decide what to build, what to improve, and which user segments to prioritise.
Who is this tool for (ICP)?
These tools are ideal if you:
- Are a SaaS, mobile app, or product-led company
- Care deeply about activation, feature adoption, and retention
- Have product/growth managers who ask “what do users actually do?”
- Need self-serve analytics instead of only data-team dashboards
How this tool fits in this AI-first era?
They provide rich behavioural event streams that are perfect inputs for AI models. AI can detect patterns and make predictions that humans would miss.
- Power churn prediction and LTV modelling
- Enable AI-driven onboarding and feature recommendations
- Feed segments into marketing tools for personalised campaigns
How does Mixpanel / Amplitude work?
You implement SDKs or server-side tracking and send events with properties (e.g., plan, device, cohort). The tools then aggregate those events into reports like funnels, retention curves, cohorts, and flows. Teams explore this data via a visual UI and push key audiences into marketing and messaging tools.
Free tier?
Yes, both offer free starter plans with usage limits.
Strengths?
- Powerful funnels, cohorts, and retention analysis
- Designed for self-serve exploration by product/growth teams
- Strong integration options with other tools in your stack
Weaknesses?
- Require thoughtful event design and clean implementation
- Costs can climb with high event volumes
- Can overlap with GA4/BI if roles aren’t clearly defined
Key Capabilities?
They cover the core product analytics use cases.
- Event-based user journey and feature usage tracking
- Cohorts, retention, and segmentation
- Experimentation support (especially in Amplitude)
- Audience sync to messaging and ad platforms
Pricing snapshot?
- Free: $0 – up to 1M monthly events
- Growth: $0 base for first 1M events, then from ≈$0.28 per 1,000 extra events
- Enterprise / MTU plans: from ≈$20,000/year (MTU-based, via sales)
Best for?
Mixpanel/Amplitude are best for product-led teams that want to optimise activation, engagement, and retention systematically. They’re particularly valuable when you already have signups but need to figure out why some users become power users and others churn.
Rating
3️⃣ Matomo
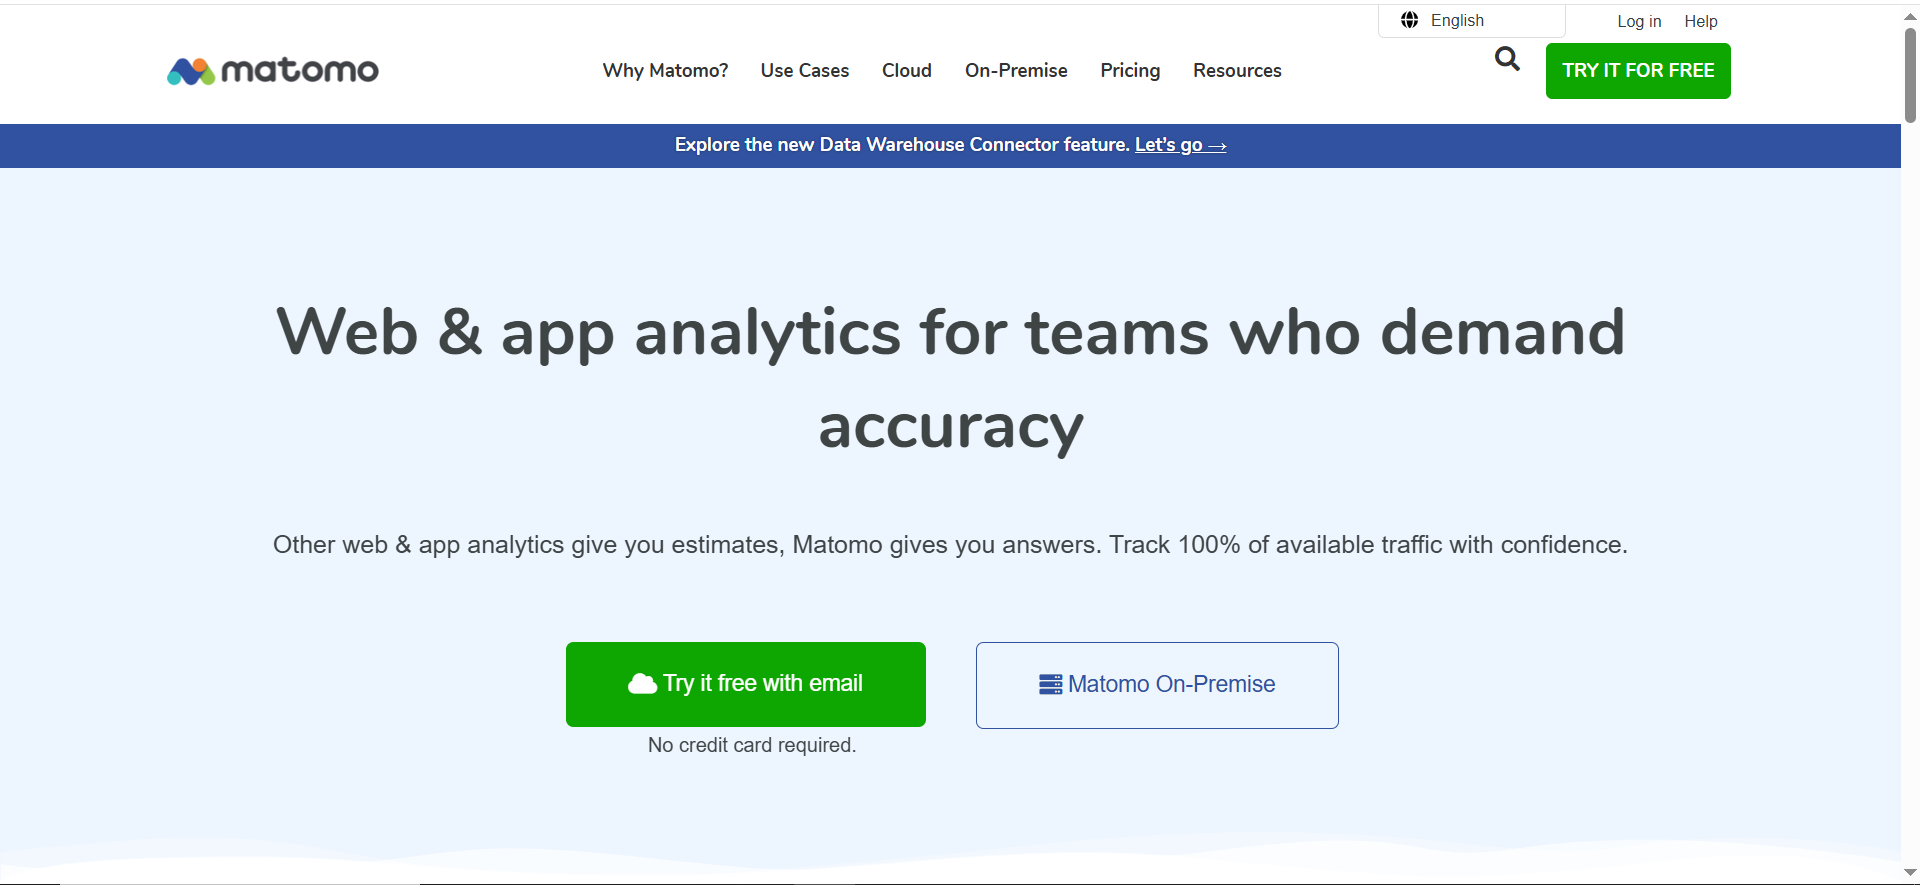
What it does?
Matomo is a web analytics platform focused on privacy and data ownership. It offers similar reports to Google Analytics—traffic, behaviour, goals, ecommerce—but can be fully self-hosted. You control where data lives and how it’s processed, which is vital for some industries and regions.
Why teams use it?
Teams choose Matomo when they want analytics without sending data to Google or US-based servers. It’s popular with privacy-conscious brands, public sector organisations, and companies under strict compliance requirements. It allows them to remain data-driven without compromising internal data policies.
Who is this tool for (ICP)?
Matomo is well-suited if you:
- Operate in highly regulated sectors or under strict privacy rules
- Need data residency in specific regions (e.g., EU)
- Have technical resources to self-host or manage more complex setups
- Want a GA alternative with more control
How this tool fits in this AI-first era?
Matomo gives you a privacy-safe analytics layer that can still feed AI systems. You keep sensitive behavioural data under your own control.
- Supports “private AI” setups where data doesn’t leave your environment
- Lets you pre-aggregate or anonymise data before using AI tools
- Helps align AI initiatives with regulatory and compliance requirements
How does Matomo work?
You deploy Matomo on your own server or use its cloud hosting, then add a tracking tag to your site. It captures pageviews, events, goals, and campaigns and stores them in your database. You use Matomo’s UI or APIs to create reports, segments, and dashboards or to pipe data into other tools.
Free tier?
Yes for self-hosted (open source). Cloud hosting is paid.
Strengths?
- Full data ownership and on-prem/region hosting
- Strong privacy and GDPR-friendly setup
- Feature-rich for standard web analytics needs
Weaknesses?
- More setup and maintenance than GA4
- Smaller integration ecosystem and community
- UI/UX isn’t as polished for non-technical users
Key Capabilities?
- Web analytics: traffic, sources, goals, ecommerce
- Privacy controls and consent tools
- Custom dimensions and events
- APIs for custom integrations and reporting
Pricing snapshot?
- Starter: $0
- Plus: from $49/month (for low MTU tiers, price scales with monthly tracked users; discount for annual billing)
- Growth & Enterprise: custom pricing (contact sales)
Best for?
Matomo is best for organisations where compliance and control override convenience, especially in EU and regulated industries. It’s a strong “GA alternative” when you need similar insights but different data governance.
Rating
4️⃣ Google Search Console (GSC)
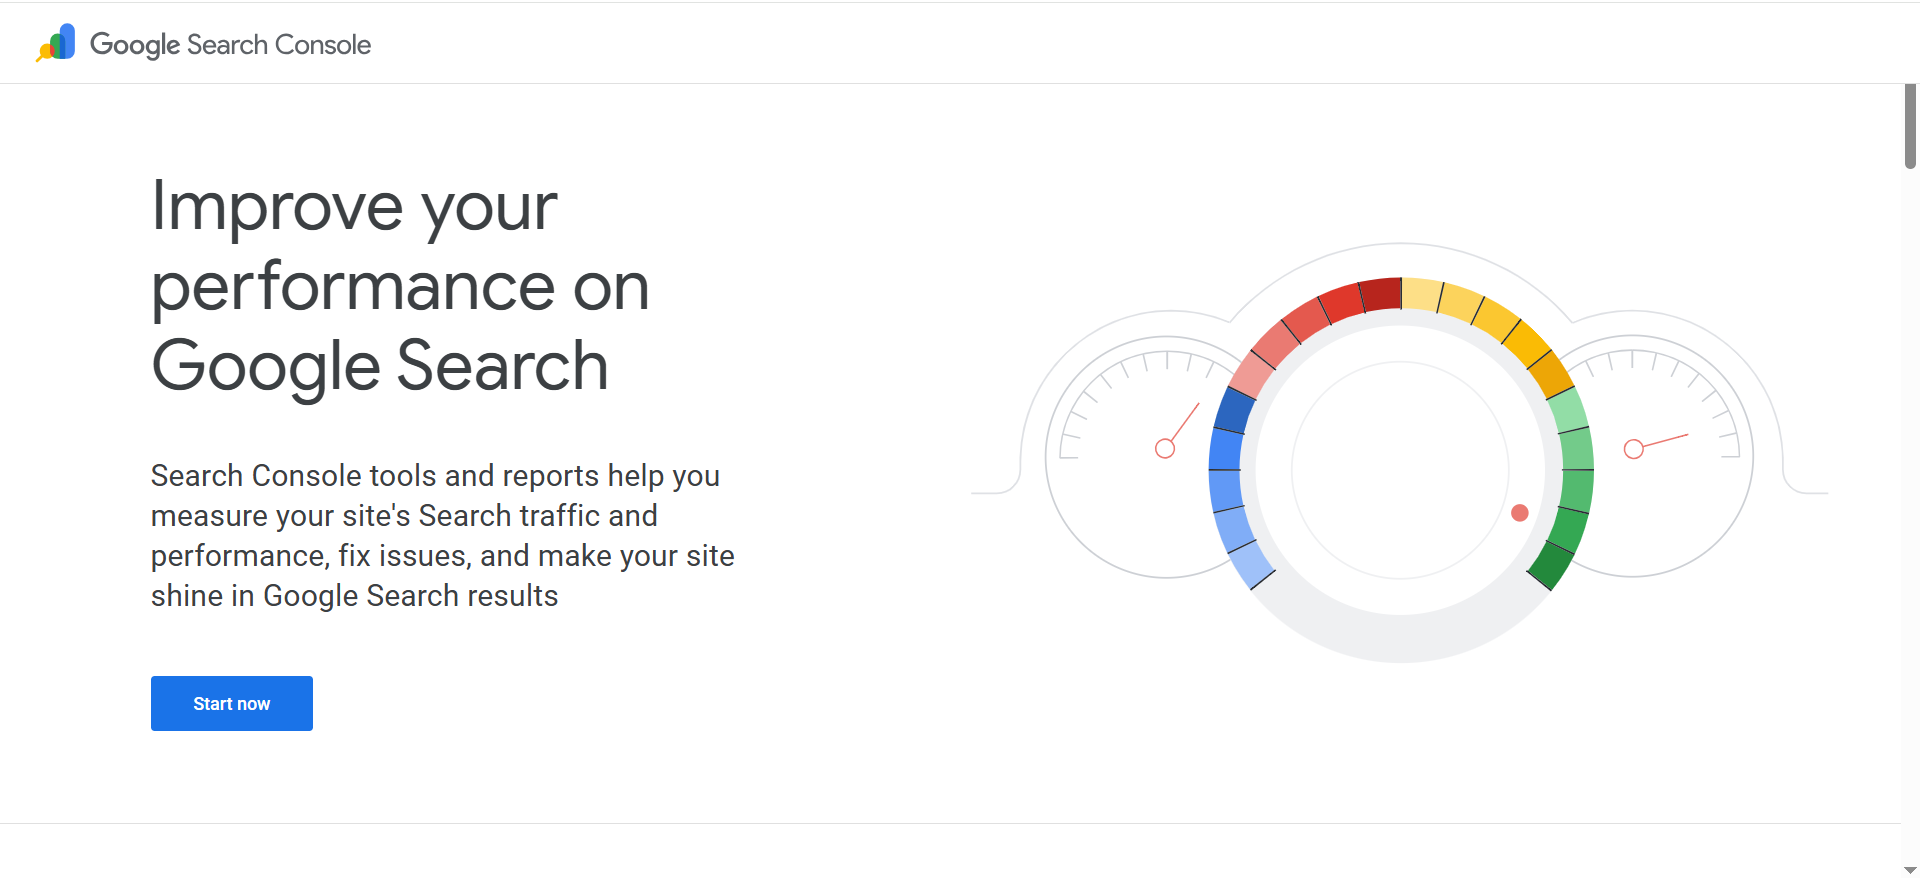
What it does?
Google Search Console is a free tool that shows how your site performs in Google Search. It reports queries, clicks, impressions, CTR, and average position, plus indexing status, Core Web Vitals, and issues like manual actions. It’s essentially your SEO control panel for Google.
Why teams use it?
Teams use GSC because it’s the only place to get first-party query and indexing data directly from Google. It’s vital for understanding which pages and keywords are working, diagnosing drops, and managing technical SEO. Even when you use Ahrefs or Semrush, you still rely on GSC as the ground truth.
Who is this tool for (ICP)?
GSC is essential if you:
- Want organic traffic from Google (so… everyone)
- Work in SEO, content, or technical marketing
- Manage site migrations or large websites
- Need to monitor site health and search visibility
How this tool fits in this AI-first era?
GSC’s search and indexing data remain the core signal for how Google sees your site, even as AI Overviews roll out. It pairs perfectly with AI tools that analyse trends and suggest SEO actions.
- Feeds AI systems with real keyword and CTR data
- Helps AI identify content gaps and cannibalisation
- Informs decisions on where to invest in topical authority
How does Google Search Console work?
You verify site ownership, then GSC starts showing performance and coverage data. You can see which queries trigger impressions, which pages get clicks, and what technical issues are blocking indexing. Data is available via the UI or API for exports and dashboards.
Free tier?
Yes, completely free.
Strengths?
- Direct, first-party search data from Google
- Essential coverage, CWV, and manual action reports
- Indispensable for serious SEO work
Weaknesses?
- Limited competitive and keyword discovery features
- Interface and concepts can be intimidating for beginners
- Data lag of a couple of days
Key Capabilities?
- Performance report (queries, pages, CTR, position)
- Coverage and sitemaps
- Core Web Vitals and page experience
- Security & manual actions alerts
Pricing snapshot?
- 100% free
Best for?
GSC is best for literally any site that wants Google traffic. It’s the first SEO tool to set up and the last one you should ignore when troubleshooting drops or planning content.
Rating
5️⃣ Ahrefs

What it does?
Ahrefs is an SEO and competitive intelligence platform known for its backlink index and keyword data. It helps you analyse competitors, discover profitable keywords, and understand how sites earn and lose organic traffic. It’s widely used for link building, content planning, and technical SEO.
Why teams use it?
Teams use Ahrefs when they need deep, reliable SEO data rather than surface-level metrics. It’s great for seeing what’s working for competitors, finding content gaps, and tracking rankings over time. Agencies and SEO-heavy brands often rely on it daily to guide strategy.
Who is this tool for (ICP)?
Ahrefs is especially useful if you:
- Run an SEO/content-heavy growth program
- Are an agency managing multiple clients
- Need strong backlink and competitor analysis
- Take link-building and authority seriously
How this tool fits in this AI-first era?
Ahrefs gives you the “outside-in” search and link data that AI alone can’t guess. Its data feeds AI-powered clustering, briefing, and content optimisation workflows.
- Helps track visibility not just in classic SERPs, but increasingly in AI/LLM surfaces
- Provides link and authority signals AI tools can’t see from your analytics alone
- Fuels AI-driven topic and content planning with trustworthy inputs
How does Ahrefs work?
Ahrefs crawls the web and builds a massive index of pages, links, and SERPs. You query that data through modules like Site Explorer, Keywords Explorer, Content Explorer, and Site Audit. You can track rankings, explore competitor performance, and export data for external dashboards.
Free tier?
Limited free (Ahrefs Webmaster Tools for your own sites); full suite is paid.
Strengths?
- Excellent backlink data and search metrics
- Strong competitor and content gap insights
- Very mature and trusted in the SEO community
Weaknesses?
- Expensive for freelancers or very small teams
- Has a learning curve for new SEOs
- Focused mainly on SEO, not all marketing channels
Key Capabilities?
- Keyword and topic research
- Backlink analysis and link intersect
- Rank tracking and SERP features
- Site audit for technical issues
Pricing snapshot?
- Lite: $129/month
- Standard: $249/month)
- Advanced: $449/month)
- Enterprise: $1,500+/month, annual commitment)
Best for?
Ahrefs is best for serious, ongoing SEO and content programs where search is a primary growth lever. If you care about links, authority, and competitive SEO intelligence, it’s usually one of the first tools to consider.
Rating
6️⃣ Semrush

What it does?
Semrush is an all-in-one marketing platform covering SEO, PPC, content, social, and competitive research. It offers keyword research, rank tracking, site audits, backlink analysis, social posting, and more. It aims to centralise most of your acquisition-related intelligence in one interface.
Why teams use it?
Teams use Semrush when they want one suite instead of several point tools. It’s excellent for planning and tracking SEO, but also supports PPC research, PLA insights, social media, and local SEO. Agencies like its reporting and “all-in-one” value; in-house teams like its breadth across channels.
Who is this tool for (ICP)?
Semrush works well if you:
- Run multi-channel marketing (SEO, PPC, content, social, local)
- Are an agency needing a central tool for many clients
- Want strong SEO plus extras like PPC and social modules
- Prefer one subscription over managing 3–4 separate tools
How this tool fits in this AI-first era?
Semrush is leaning into AI for content and SEO automation and now for “AI visibility” (how brands appear in AI search/LLM results). It enhances keyword and content workflows with AI-generated clusters, briefs, and optimisation suggestions.
- Tracks brand exposure in AI-driven search experiences
- Supports AI-assisted content, on-page SEO, and competitive analysis
- Feeds reliable search data into your own AI/BI pipelines
How does Semrush work?
You create a project for each domain, connect GA/GSC, and let Semrush crawl and track your site. You then use modules like Keyword Magic Tool, Site Audit, Position Tracking, and the Content Marketing Toolkit. Data can be exported or used in built-in reports.
Free tier?
Limited free access; full value is in paid plans.
Strengths?
- Broad “all-in-one” coverage across SEO, PPC, and more
- Rich keyword and competitive data
- Strong set of tools for agencies and multi-market brands
Weaknesses?
- Pricing can be steep for small teams
- Interface can feel crowded and complex
- Easy to underutilise if you only need a few modules
Key Capabilities?
- Keyword research and SERP analysis
- Rank tracking and site audits
- Backlink and competitor intelligence
- Content, PPC, social, and local SEO modules
Pricing snapshot?
- Semrush One Starter: ≈$165.17/month
- Semrush One Pro+ and Max: higher tiers – exact values shown only on the live pricing page and may vary by region/add-ons
Best for?
Semrush is best for teams and agencies that want one primary platform for SEO and adjacent channels. It works particularly well when you’re serious about content + SEO, but also need a view of PPC and competitors.
Rating
7️⃣ Looker Studio
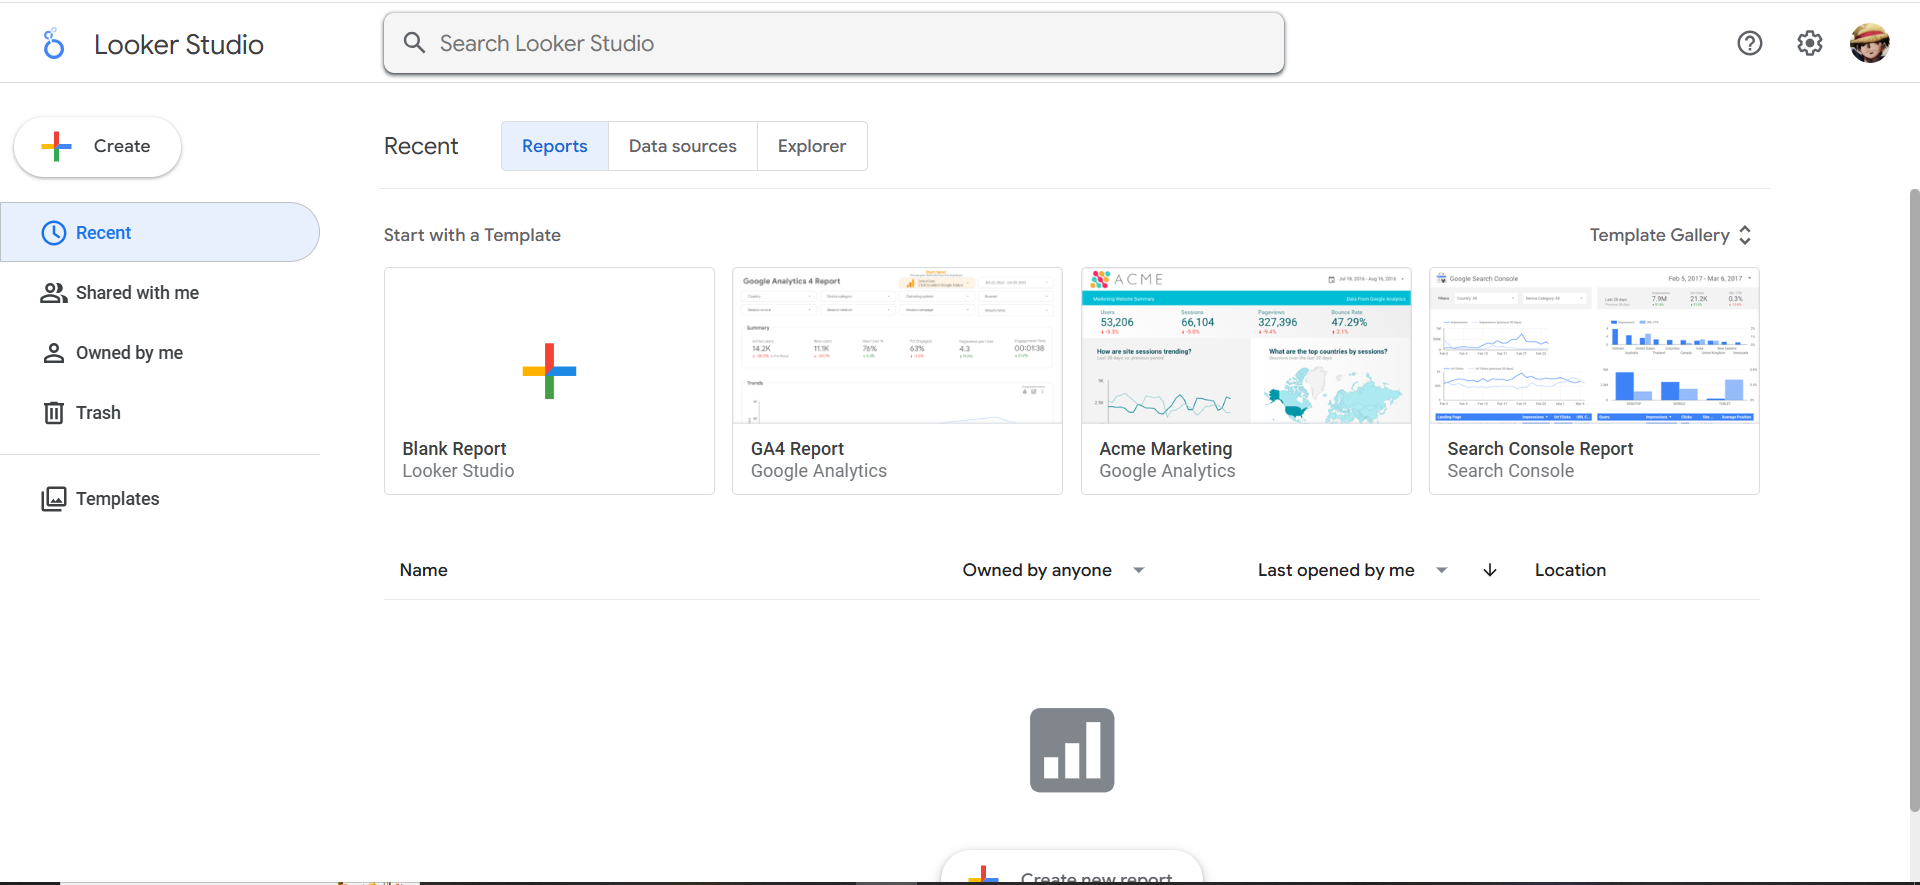
What it does?
Looker Studio (formerly Data Studio) is Google’s free dashboard and reporting tool. It connects to GA4, GSC, Google Ads, Sheets, BigQuery, and many third-party sources. You use it to build interactive, shareable dashboards instead of static spreadsheets.
Why teams use it?
Teams use Looker Studio to give stakeholders live, visual reporting without buying full-blown BI tools. It’s especially popular with agencies for client dashboards, and with in-house teams that already use GA4 and GSC. It’s flexible enough for custom metrics and blending, yet simple enough for non-developers.
Who is this tool for (ICP)?
Looker Studio is a good fit if you:
- Need cross-channel dashboards on a budget
- Are an agency delivering regular performance reports
- Use a lot of Google stack data (GA4, GSC, Ads, BigQuery)
- Want marketers, not just analysts, to build reports
How this tool fits in this AI-first era?
Looker Studio is where AI-generated insights and metrics can be visualised for humans. It acts as the neutral “front-end” to AI-enhanced data models.
- Displays AI-derived metrics like predicted LTV or churn
- Integrates with warehouses where AI/ML models live
- Can be augmented by AI tools that explain charts and anomalies
How does Looker Studio work?
You create a report, attach one or more data sources, and build charts using drag-and-drop. It supports filters, date controls, calculated fields, and simple blending. Reports refresh when underlying data updates and can be shared via links or embedded.
Free tier?
Yes (Looker Studio is free; Looker Studio Pro is paid).
Strengths?
- Free and very flexible for most marketing reporting
- Deeply integrated with Google ecosystem
- Good balance between power and usability
Weaknesses?
- Can be slow or fragile on very complex/large reports
- Governance/versioning weaker than enterprise BI tools
- Often requires paid connectors for certain platforms
Key Capabilities?
- Custom, interactive dashboards
- Multiple data source connections and blending
- Calculated fields and simple data modelling
- Easy sharing/embedding
Pricing snapshot?
- Looker Studio (standard): $0
- Looker Studio Pro: from $9 per user per project per month (pricing varies by region & Google Cloud account)
Best for?
Looker Studio is best for marketing teams and agencies that need professional, always-on dashboards without investing in heavy BI. It’s ideal as a reporting layer on top of GA4, GSC, and connector tools like Supermetrics.
Rating
8️⃣ Supermetrics
What it does?
Supermetrics is a data connector platform for marketers. It pulls data from ad, analytics, and CRM platforms into destinations like Google Sheets, BigQuery, Looker Studio, and other BI tools. It turns manual exports into automated, scheduled data pipelines.
Why teams use it?
Teams use Supermetrics to centralise cross-channel data without writing code or building ETL jobs. Agencies rely on it to automate multi-client reporting and feed their dashboards. In-house teams use it to get clean, consistent tables for deeper analysis.
Who is this tool for (ICP)?
Supermetrics is ideal if you:
- Have many channels/platforms to report on regularly
- Use Looker Studio, Sheets, or a warehouse as your reporting/AI layer
- Are an agency with lots of accounts to maintain
- Want data pipelines without building a full data engineering team
How this tool fits in this AI-first era?
Supermetrics provides the structured marketing data that AI tools need. It ensures consistent, well-shaped data is available in your warehouse or reporting tool.
- Feeds AI/ML models with unified cross-channel performance data
- Automates data prep so AI can focus on insight, not plumbing
- Helps integrate new channels (including AI-era traffic sources) into existing models
How does Supermetrics work?
You connect your data sources and choose a destination. Supermetrics then runs scheduled queries to pull metrics and dimensions into a destination table or sheet. From there, dashboards, BI tools, or AI agents consume the data.
Free tier?
Free trial only; ongoing usage is paid.
Strengths?
- Huge library of marketing connectors
- Marketer-friendly UI for setting up pipelines
- Works with common destinations (Sheets, Excel, warehouses, BI tools)
Weaknesses?
- Subscription cost adds up with more connectors and accounts
- You still need a reporting/analytics layer on top
- Some complex setups require downstream modelling
Key Capabilities?
- Automated data extraction from marketing platforms
- Scheduled refresh and historical sync
- Templates for common dashboards and reports
- Support for warehouses as destinations
Pricing snapshot?
- Starter: from $29/month
- Growth: from $159/month
- Pro: from $399/month (yearly)
- Business / Enterprise: custom pricing
Best for?
Supermetrics is best for teams that have outgrown manual exporting but don’t want to build custom ETL. It’s particularly powerful for agencies and data-savvy marketing teams building centralised performance tables.
Rating
9️⃣ HubSpot Marketing Hub
What it does?
HubSpot Marketing Hub is a marketing automation and analytics platform that runs on top of HubSpot’s CRM. It manages emails, forms, landing pages, workflows, lead scoring, and multi-touch attribution. It tracks the entire lifecycle from first touch through lead, opportunity, and customer.
Why teams use it?
Teams use HubSpot when they want marketing and sales data in one system. Instead of stitching together email, CRM, and analytics, HubSpot gives a unified view of contacts, deals, and campaigns. It’s especially valuable in B2B, where you need to prove how marketing influences pipeline and revenue.
Who is this tool for (ICP)?
HubSpot is a strong fit if you:
- Are a B2B SaaS, service, or high-value B2C brand
- Have multi-step sales cycles and care about full-funnel visibility
- Need both marketing automation and CRM in one place
- Want a user-friendly platform with lots of training and partners
How this tool fits in this AI-first era?
HubSpot combines AI features with rich lifecycle data, making AI-driven prioritisation and personalisation easier. It’s a natural hub for AI copilots that analyse funnel health and suggest actions.
- AI-assisted email, copy, and workflows
- Predictive scoring and insights based on CRM + marketing data
- Central data source for AI models spanning marketing and sales
How does HubSpot Marketing Hub work?
You connect your website, forms, email, and ad accounts, then track every interaction as contact and company timeline events. Workflows automate nurturing and routing; dashboards and reports show performance by campaign, lifecycle stage, and revenue. Attribution models tie deals back to marketing efforts.
Free tier?
Yes (free CRM and basic tools); advanced marketing features are paid.
Strengths?
- Unified CRM + marketing data across the funnel
- Friendly UI and strong onboarding/education
- Robust ecosystem of apps and partners
Weaknesses?
- Can get expensive as contacts and hubs grow
- Complex setups require careful architecture and governance
- Less flexible than bespoke warehouse+BI for very advanced analytics
Key Capabilities?
- Email, automation, and lead scoring
- Multi-touch attribution and campaign analytics
- Landing pages, forms, and ad integration
- CRM and pipeline analytics across teams
Pricing snapshot?
- Marketing Hub Professional: from about $800/month (annual commitment, includes more contacts & automation)
- Marketing Hub Enterprise: from about $3,600/month (annual commitment, higher contact tiers and advanced features)
Best for?
HubSpot Marketing Hub is best for teams that need to connect marketing directly to pipeline and revenue, not just clicks. It’s especially strong in B2B and service-based businesses where nurturing and sales alignment matter.
Rating
What Are Marketing Analytics Tools (and Why They Matter for Growth)?
Marketing analytics tools help you collect, connect, and understand data from your marketing channels so you can answer questions like:
- Which channels drive the most leads or sales?
- Which campaigns are profitable—and which burn cash?
- Where do people drop off in our funnel?
- What’s the actual ROI of our marketing?
They pull in data from places like:
- Your website or app (traffic, behavior, conversions)
- Ad platforms (Google Ads, Meta, LinkedIn, TikTok, etc.)
- SEO & content (rankings, clicks, organic traffic)
- Email & CRM (opens, clicks, revenue, LTV)
- E-commerce or sales systems (orders, revenue, refunds
Used well, these tools help you:
- Cut wasted spend on campaigns that don’t perform
- Double down on channels that actually drive profit
- Find bottlenecks in your funnels and fix them
- Prove ROI to stakeholders or clients
💡 In short: they turn your marketing from “guessing” into a repeatable, measurable growth system. That’s exactly what a partner like The Rank Masters, B2B SaaS SEO Agency is optimising for.
Reporting vs. True Analytics
▶️ Most businesses get stuck at reporting:
“Here are your clicks, impressions, and followers for last month.”
▶️ True analytics goes further:
“Here’s why performance changed, what it means, and what we should do next.”
The tools below can do both, but it’s how you use them that creates data-driven growth.
If you’re looking at reports every month but still not sure what to change, scale, or stop, that’s exactly the gap a proper analytics stack (and a good partner) should close. Our CRO for product-led content service is built to turn those insights into faster product-led growth.
👉 Not sure if your current stack is giving you real answers? You can Contact The Rank Masters to get a quick audit and see where your tracking, reporting, or funnel visibility is holding back growth.
How to Choose the Right Marketing Analytics Stack
The right marketing analytics stack depends on your stage, channels, and resources. Use the frameworks below to pick a smart, ROI-first setup instead of a bloated one you’ll never fully use. If you want help building a stack that actually drives pipeline, The Rank Masters, B2B SaaS SEO Agency can do this end-to-end with you.
If You’re a Solo Founder or Early-Stage Startup
Goal: Get clarity using mostly free/low-cost tools.
- GA4 for web analytics
- Google Search Console for SEO insights
- One SEO tool (Ahrefs/Semrush) if budget allows
- Looker Studio for basic dashboards
- Native ad platform dashboards to optimize campaigns
Focus on:
- Basic conversion tracking (leads, purchases)
- A simple funnel (landing → lead → customer)
- Weekly review of traffic, leads, and cost per lead/acquisition
👉 At this stage, your stack should answer: “What’s working enough that I should double down—and what should I cut right now?”
For picking tools, this ROI-first SEO tool stack for SaaS is a great reference.
If You’re a Growing Brand With a Small Team
Goal: Move from “reports” to real performance insights.
Add:
- Email/CRM analytics (HubSpot, Klaviyo, etc.)
- A connector tool (Supermetrics/Funnel) for multi-channel reports
- Standard dashboards in Looker Studio or a tool like Databox
Focus on:
- Multi-channel attribution (who starts vs who closes conversions)
- Core KPIs: CAC, ROAS/ROI, LTV, funnel conversion rates
- Monthly deep dives plus weekly performance check-ins
👉 If you’re struggling to turn data into action, your team may also need better CRO around key pages. That’s where CRO for product-led content becomes a big unlock.
If You’re an Agency Managing Multiple Clients
Goal: Scalable, repeatable reporting that doesn’t eat your life.
Stack might include:
- Per-client GA4 & GSC
- Connectors (Supermetrics/Funnel)
- Agency-friendly dashboarding (Whatagraph / DashThis / Databox / Looker Studio)
- Your own “framework” dashboards (SEO, PPC, Social, Full-funnel)
Focus on:
- Standardizing naming conventions and metrics across clients
- White-label, automated reports
- Clear storytelling in dashboards: “Here’s what happened, why, and what we’re doing next.”
If You’re Data-Mature or Enterprise
Goal: Connect marketing data to the rest of the business.
Add or lean into:
- Data warehouse (BigQuery, Snowflake, etc.)
- BI tool (Power BI, Tableau, Looker)
- Product analytics (Mixpanel/Amplitude)
Focus on:
- Full customer journeys from first touch to revenue and beyond
- Attribution that aligns with real sales cycles
- Experimentation (A/B tests, holdout groups, incrementality)
👉 At this level, you’re often also tracking brand impact in AI-driven search results. For that, see this guide on Brand visibility in AI search and how to measure your footprint.
Example Marketing Analytics Stacks You Can Copy
Don’t want to start from a blank page? Here are plug-and-play stack examples you can adapt to your business. For SEO and content specifically, this SaaS SEO software recommendations piece pairs nicely with the stacks below.
1. The “Lean Startup” Stack
For small teams and early-stage businesses.
- GA4 – web analytics & conversions
- GSC – organic search performance
- Looker Studio – dashboards for traffic & conversions
- Native ad dashboards – performance by campaign
- One SEO tool (optional) – keyword & competitor research
This stack answers:
- Where does our traffic come from?
- Which campaigns bring leads/sales?
- Is organic search improving over time?
2. The “DTC E-Commerce Growth” Stack
For online stores focused on revenue.
- GA4 – traffic & e-commerce funnels
- GSC – SEO performance
- Klaviyo – email & SMS revenue analytics
- Platform analytics (Meta, Google Ads, TikTok)
- Connector + Looker Studio – multi-channel revenue dashboards
This stack answers:
- Which channels drive profitable sales?
- How much revenue comes from email/SMS vs ads?
- Where do customers drop off in the funnel?
3. The “B2B SaaS Pipeline & Revenue” Stack
For SaaS businesses with sales cycles.
- GA4 – website & signup journeys
- GSC + SEO tool – organic performance
- HubSpot – lifecycle from lead to customer
- Product analytics (Mixpanel/Amplitude) – in-app behavior
- BI / Looker Studio – pipeline & revenue dashboards
This stack answers:
- Which channels bring qualified leads and opportunities?
- What user behaviors lead to activation and retention?
- How do marketing and product jointly impact churn and expansion?
4. The “Agency Command Center” Stack
For agencies managing multiple clients and channels.
- GA4 & GSC per client
- Connectors (Supermetrics/Funnel) pulling ad + marketing data
- Dashboarding tool (Whatagraph / DashThis / Databox / Looker Studio)
- Standard templates per service (SEO, PPC, Social, Full-funnel)
This stack answers:
- At a glance, which clients are up or down this month?
- Which channels drive results across the portfolio?
- How do we show clear, repeatable value to each client?
▶️ Not sure which stack fits your stage?
Contact The Rank Masters and we’ll map out a right-sized analytics stack for your growth goals in one strategy call.
Implementation Roadmap – From Tools to a Growth Engine
Tools alone don’t create growth.
The way you implement and use them does.
Here’s a simple, step-by-step roadmap to turn a random tool stack into a repeatable revenue engine (and exactly the kind of system The Rank Masters, B2B SaaS SEO Agency builds for SaaS teams).
Step 1: Define Your Growth Questions and KPIs
Start with questions, not tools:
- How do we acquire customers profitably?
- Which channels are truly moving the needle?
- How do we keep customers longer and increase LTV?
Then define KPIs like:
- CAC, LTV, ROAS, conversion rate
- Lead quality (MQL, SQL, etc.)
- Retention, repeat purchase rate
Step 2: Audit Your Current Tracking
Check:
- Are conversion events set up correctly (purchases, leads, signups)?
- Are UTMs consistent across campaigns?
- Are pixels and tags firing correctly (use tools like Tag Assistant)?
Fix these before you worry about fancy dashboards.
Step 3: Select Your Core Tools
Pick:
- 1 web analytics tool (GA4, Matomo, etc.)
- 1 SEO/content tool (Ahrefs or Semrush) if search is important
- 1 email/CRM tool with good analytics
- 1 reporting layer (Looker Studio / Databox / BI)
Avoid “tool sprawl”: don’t buy six tools that basically do the same thing.
You want depth of usage, not a long list of logins.
👉 If SEO is a key growth lever, this ROI-first SEO tool stack for SaaS is a useful framework for picking tools that actually drive pipeline, not just rankings.
Step 4: Standardize Naming & Tracking
Decide on:
- UTM structures (source/medium/campaign naming)
- Event naming conventions (e.g. lead_submitted, checkout_started)
- Channel naming so you can group results properly
This “boring” step is what makes your data comparable and trustworthy.
Step 5: Build Your Core Dashboards
At minimum, create:
- Weekly performance dashboard: Traffic, leads/sales, main KPIs
- Channel dashboard: SEO, Paid, Email, Social
- Funnel dashboard: Landing → signup/lead → revenue
Keep them simple. If stakeholders can’t understand them in 30 seconds, they won’t use them.
👉 For inspiration on the reporting layer and tool options, see this breakdown of Best SEO reporting software, which compares dashboards and reporting tools B2B SaaS teams actually use.
Step 6: Set Alerts and Cadences
- Daily/weekly checks of key metrics
- Email alerts for big drops/spikes in performance
- Monthly deep-dive reviews
This creates a rhythm where data drives decisions—not just end-of-month panic.
Step 7: Review, Test, Iterate
Use insights to:
- Kill or fix underperforming campaigns
- Scale winners
- Improve landing pages and funnels
- Test new channels or creatives
Analytics isn’t a one-time project; it’s an ongoing habit.
How The Rank Masters Builds Data-Driven Growth Systems
At The Rank Masters, we don’t just install tools and send you logins.
We help brands and agencies:
- Clarify their growth questions & KPIs
- Choose the right analytics stack for their stage
- Implement tracking and events correctly
- Build dashboards and reports that non-analysts can actually use
- Turn insights into concrete growth experiments and optimisations
Whether you’re:
- A growing brand trying to understand which channel really drives profit
- A SaaS company wanting to connect marketing with product usage and revenue
- An agency wanting to standardise and scale reporting across clients
We can help you build a marketing analytics engine that supports real, data-driven growth.
🤙 Want help choosing and setting up your analytics stack?Book a free 20-minute Analytics Strategy Call with The Rank Masters and we’ll show you exactly what your next steps should be.
Frequently Asked Questions
A marketing analytics tool helps you collect and analyse data from your campaigns, website, and customers so you can see what’s working, what’s not, and where to invest next.
Start with GA4, Google Search Console, Looker Studio, and native ad dashboards. Add an SEO tool and an email/CRM platform with strong reporting as you grow.
Yes—up to a point. You can get very far with GA4, GSC, and Looker Studio. Paid tools become essential when you need deeper SEO, multi-channel reporting, or advanced attribution.
Most businesses do well with 3–6 core tools, as long as they’re set up correctly and used consistently.
Regularly test forms and funnels, check tags and pixels, validate conversions across platforms, and keep naming conventions consistent.
Improved tracking gives value almost immediately. But behavior changes—cutting wasted spend, scaling winners, fixing funnels—typically show impact over 1–3 months.
If you lack time, technical skills, or internal bandwidth, partnering with an agency like The Rank Masters can shortcut months of trial and error and give you a working analytics system much faster.
Conclusion: Turn Your Analytics Stack Into a Growth Engine
Most teams don’t fail because they lack tools. They fail because their data isn’t clean, connected, or tied to real growth decisions.
With the right marketing analytics stack, you can:
- See exactly which channels and campaigns drive pipeline and revenue
- Cut wasted spend and double down on what actually works
- Build dashboards and cadences that keep your whole team aligned on growth
But building that system in-house “on top of everything else” can easily stall for months.
If you want a partner who lives and breathes data-driven growth for SaaS, that’s exactly what we do at The Rank Masters, B2B SaaS SEO Agency. Our team combines analytics, SEO, CRO, and content so your stack doesn’t just produce reports, it produces pipeline.
If you’re ready to:
- Fix broken tracking and messy UTMs
- Build dashboards your leadership actually uses
- Turn key pages and product-led content into real conversion assets
You’ll get a lot of value from our specialised CRO for product-led content and SaaS content marketing services.
Next step:Share where you are today and where you want your growth engine to be. Contact The Rank Masters, and we’ll map out a tailored analytics + CRO action plan you can start implementing right away—whether you work with us long term or not.