

If you need free, flexible dashboards and your team can handle some setup, start with Looker Studio. If you want fast, “executive-ready” dashboards with minimal BI work, choose Databox. If you’re an agency that lives and dies by client reporting, templates, and white-label, AgencyAnalytics is usually the fastest path to scale.If your reporting must connect rank tracking to forecasting and business impact, programmatic SEO reporting frameworks can help standardize scalet. And if you want an all-in-one platform where reporting is tightly tied to SEO workflows (audit, keywords, competitive insights), Semrush is the familiar powerhouse.
📋 Get Listed / Advertisement
We update this guide monthly. Want your tool featured? Contact: [email protected].
Table of Contents
Best Tools for SEO Reporting & Client Dashboards (Quick Comparison)
| Tool | Best for | Why it wins | Typical cost (starting point) |
|---|---|---|---|
| Looker Studio | Custom dashboards + sharing | Flexible, “BI-lite,” strong connectors | Self-serve is no-cost; Pro is ~$9/user/project/mo |
| Databox | Exec dashboards fast | Clean UI, quick setup, alerts/scorecards | Pricing varies by plan/data sources |
| AgencyAnalytics | Agencies & white-label reporting | Client templates + automation + portals | Plans advertised from $59/mo |
| SEOmonitor | Agency-grade SEO with forecasting | Reporting + planning/forecasting mindset | Pricing varies; see pricing page/trial |
| Semrush | All-in-one SEO + reporting add-ons | Huge toolkit + report builder options | Plan pricing varies; see pricing page |
1. Looker Studio
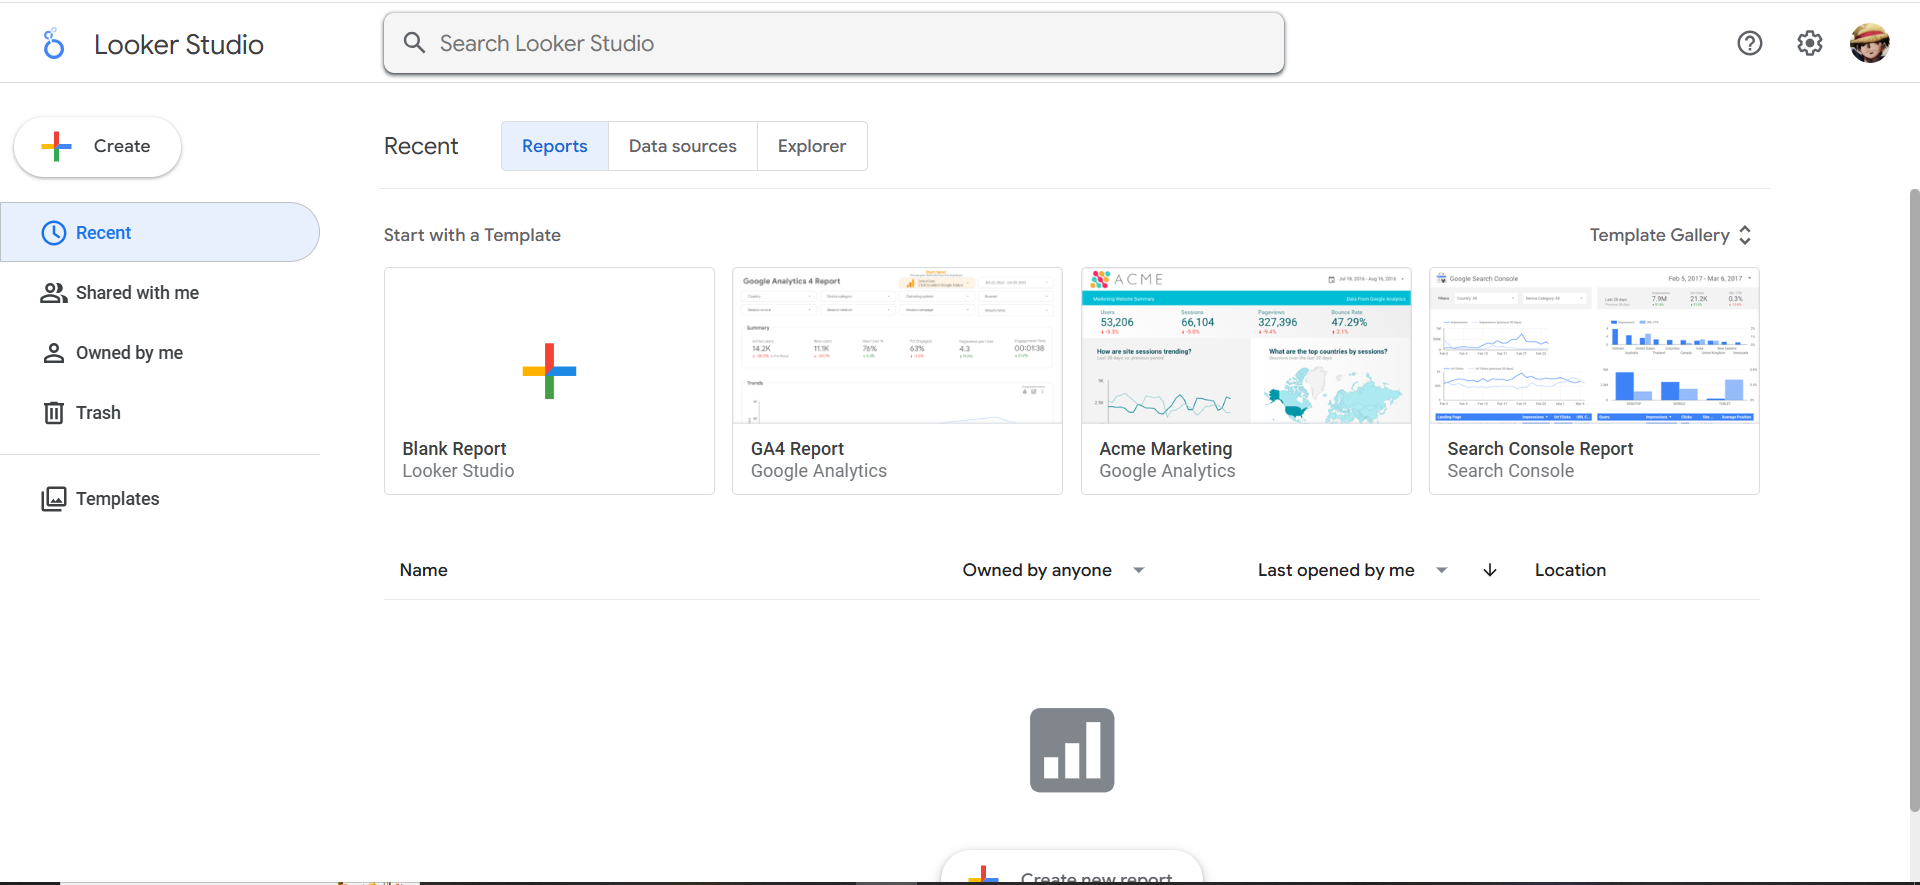
What it does
Looker Studio (formerly Google Data Studio) is a reporting and dashboard tool that lets you connect multiple data sources (Google and non-Google), model your metrics, and publish interactive dashboards you can share with clients or stakeholders. It’s widely used for SEO reporting because it’s flexible enough to combine GA4, Google Search Console, rank tracking exports, and custom spreadsheets into one “source of truth.”
Why teams use it
- Low cost of entry: The self-service version is no-cost.
- High flexibility: You can build dashboards that match exactly how your agency or org thinks about performance using a solid SaaS content marketing reporting framework.
- Client-friendly sharing: Links, scheduled delivery (via workarounds), embedded views, and permissioning.
- Scales with process: Once you build the right template, you can reuse it across accounts.
What it’s good for
- Custom client dashboards where the “default” SEO reporting templates aren’t enough
- Executive dashboards that blend SEO + business metrics (pipeline, revenue, CAC payback)
- Reporting stacks where you already have data in Sheets / BigQuery / a warehouse
- “Single pane of glass” dashboards that combine paid + organic + lifecycle metrics
When it’s a good fit
Choose Looker Studio if:
- You want maximum control over visuals and metrics definitions.
- You can invest a bit of time into setup (templates, filters, data hygiene)
- You’re comfortable with a slightly “BI-ish” workflow (calculated fields, blending, governance)
When it’s not a good fit
Avoid making Looker Studio your primary reporting engine if:
- You need agency-specific features out of the box (client portals, account provisioning, automated report packs)
- Your team doesn’t have time to manage connectors, field mappings, and ongoing maintenance
- You need advanced metric governance at scale (you may need a warehouse + BI strategy)
How to use it
Step 1: Define your dashboard “story.”
Don’t start with charts, start with the narrative your dashboard must answer in 5 minutes:
- Are we growing qualified search demand?
- Are we converting that demand into a pipeline?
- What are the top levers and the top risks?
Step 2: Standardize your data sources.
At minimum:
- GA4 (engagement + conversions)
- GSC (queries, pages, CTR, impressions)
- Rank tracking (your vendor export)
- An annotations sheet (updates, releases, migrations)
Step 3: Build a template with three layers.
- Executive layer: 6–10 KPIs, trends, and a plain-English summary
- Channel layer: SEO performance by segment (brand/non-brand, product pages, blog, demos)
- Diagnostic layer: query groups, page groups, technical health snapshots, top movers
Step 4: Add “client-safe” filters.
Let clients choose:
- date ranges
- markets (US/UK/etc.)
- product lines
- content types (blog vs landing)
Step 5: Create a QA checklist (before you share).
- Are GA4 sessions/users consistent with your analytics baseline?
- Do GSC clicks map to expected landing pages?
- Do rankings changes align with your known algorithm updates or releases?
Key capabilities
- Connectors: Built-in + partner connectors matter for SEO stacks.
- Calculated fields + blended data: Needed for blended KPIs like “SEO-assisted pipeline”
- Permissioning: Especially if you share across multiple clients
- Performance: Larger datasets may require BigQuery or extracts to keep dashboards fast
Pricing
Looker Studio Pro pricing starts at $9 per user, per project, per month (self-service Looker Studio is no charge).
Free tier?
Looker Studio does offer a free tier (the self-service version is free).
Downsides / limitations
- Maintenance overhead: Templates break when connectors change or fields rename.
- Connector costs: The dashboard tool may be free, but connectors aren’t always.
- Not agency-native: You’ll need your own process for provisioning, monthly packs, and client onboarding.
2. Databox

What it does
Databox is a marketing and business dashboard platform designed for fast setup, clean executive visuals, and automated reporting. It’s popular when you need dashboards to “just work” without building a BI mini-project.
Why teams use it
- Speed: You can get an executive dashboard live quickly.
- Executive-friendly UI: Great for leadership who wants clarity, not complexity.
- Automation: Alerts, scheduled snapshots, and recurring reporting workflows are baked in when you pair dashboards with the right SEO automation tools.
- Unified marketing view: Great when SEO is one input into the broader GTM story.
Databox positions its pricing around plan tiers and usage, with an official pricing page and trial approach.
What it’s good for
- “CEO dashboards” that show growth KPIs (pipeline, revenue, traffic, conversions) plus SEO drivers
- Weekly operating dashboards for marketing teams
- Teams that want standardized views across multiple channels
When it’s a good fit
Pick Databox if:
- You need dashboards up fast (and you don’t want to hire a Looker Studio wizard)
- Your reporting is more “business KPIs + a few SEO levers” than deep SEO diagnostics
- You want built-in scorecards and alerts
When it’s not a good fit
Databox may not be ideal if:
- You need deep SEO-specific analysis inside the tool (SERP feature nuance, page-level diagnostics)
- You require heavy customization, complex blends, or warehouse-style modeling
- Your clients expect full white-label report packs with deep SEO sections (some agencies still prefer agency-native platforms)
How to use it
Step 1: Start with “North Star + drivers.”
Your top row is the outcome metric (pipeline, signups, revenue), and under that: organic sessions, conversions, branded search demand, and a rankings/visibility summary supported by rank tracking software.
Step 2: Build two boards, not one.
- Exec board: outcomes + drivers + risks
- SEO operator board: page groups, query groups, content velocity, technical risk list
Step 3: Add “context blocks.”
When performance changes, your dashboard needs human-readable context:
- release shipped
- site migration
- new pricing page
- Google update window
- new competitor surge
Key capabilities
- Connectors for your core SEO stack (GA4, GSC, rank tracking via integrations or imports)
- Custom metrics (derived metrics are where dashboards become useful)
- Alerts/notifications and scheduled reports
Pricing
Databox’s pricing starts at $159/month (Professional plan).
Free tier?
Databox doesn’t offer a free tier, but it does offer a free 14-day trial.
Downsides / limitations
- Less “BI flexibility” than Looker Studio for custom blends and modeling
- Can become expensive at scale depending on data source counts and plan limits
- SEO nuance may require external analysis (you may still live in GSC/your rank tracker for diagnostics)
3. AgencyAnalytics
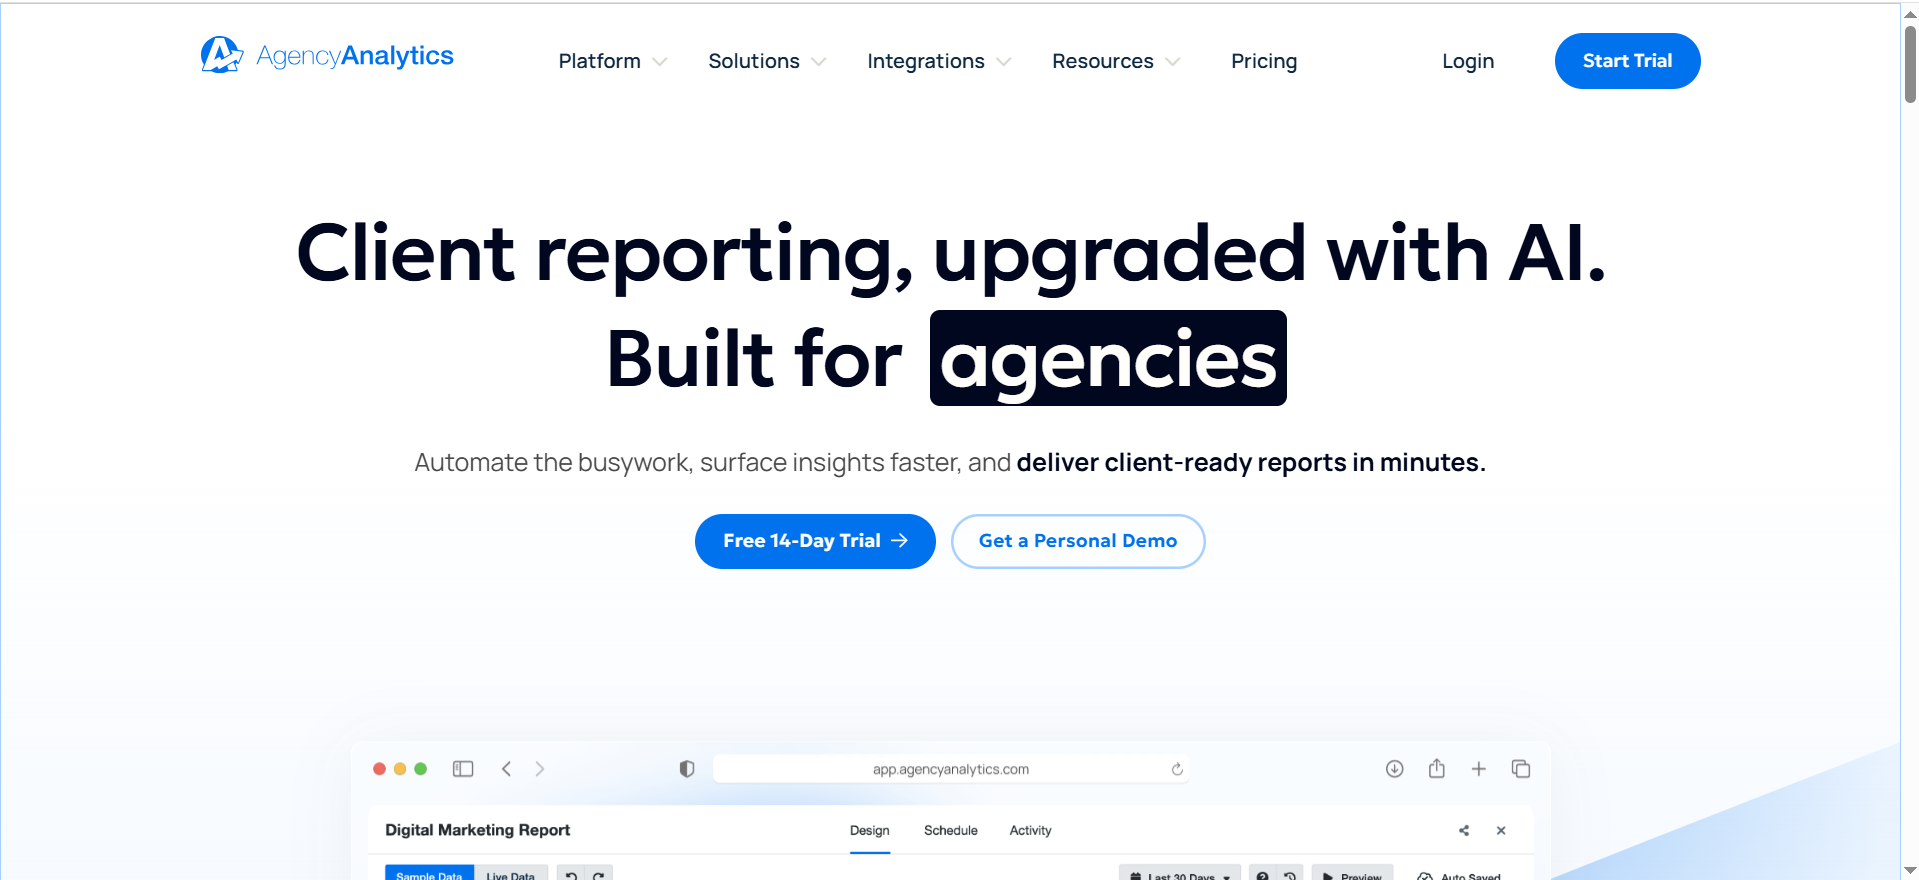
What it does
AgencyAnalytics is an agency-focused reporting platform built specifically for client dashboards across SEO, PPC, social, and more. It’s designed to help agencies scale reporting without reinventing the wheel for every new account.
Why teams use it
- Agency-first workflows: client provisioning, templating, and recurring reporting
- White-label & branding: clients see “your” reporting, not a cobbled-together dashboard
- Templates for common agency deliverables: SEO performance reports, monthly packs, campaign summaries
- Multi-client scalability: critical when you’re managing dozens of accounts
What it’s good for
- Client portals and recurring monthly SEO reporting packs
- Agencies that need standardization across service lines
- Teams that want “reporting as a product” (consistent, packaged, reliable)
When it’s a good fit
Choose AgencyAnalytics if:
- You’re an agency and your biggest pain is time spent building and updating reports
- You want client-ready dashboards without heavy BI effort
- You need white-labeling and agency-grade packaging
When it’s not a good fit
AgencyAnalytics may not be the best if:
- You want deeply custom BI-style modeling
- You need a “warehouse + BI” governance strategy (AgencyAnalytics is a reporting product, not a data platform)
- Your reporting requires advanced custom data blending across product analytics, CRM, and billing (possible, but may push you toward BI tools)
How to use it
Step 1: Build a “base template” for each service tier.
Example:
- SEO Foundation: GSC + GA4 + basic rank tracking + technical health snapshot
- SEO Growth: adds content velocity + conversion segmentation + competitor tracking
- SEO + AI Visibility: adds AI Overviews tracking, citation/mention trend reporting, especially when paired with an answer engine optimization approach
Step 2: Create a standardized monthly narrative.
Your report should always answer:
- what changed
- why it changed
- what we’re doing next
- what we need from the client
Step 3: Productize your annotations.
Dashboards without context create churn. Make it easy to log:
- content published
- pages updated
- technical changes
- campaign launches
- algorithm turbulence windows
Key capabilities
- Integration coverage for your stack
- White-label control (logos, colors, domains)
- Scheduled reporting, portals, and automated delivery
Pricing
AgencyAnalytics’ pricing starts at $59/month.
Free tier?
AgencyAnalytics doesn’t offer a free tier, but it does offer a free trial (14 days).
Downsides / limitations
- Less flexible than Looker Studio for unusual modeling needs
- Template lock-in risk: If you don’t customize the “story,” reports can feel generic
- Needs a strategy layer: It won’t fix unclear KPIs or mismatched client expectations by itself
4. SEOmonitor

What it does
SEOmonitor is positioned as an SEO platform for agencies that connects performance reporting with planning and forecasting. It’s especially relevant when you need to explain results to stakeholders in a way that ties to business outcomes and predictable growth. SEOmonitor explicitly frames itself around “complete organic performance” and agency needs.
Why teams use it
- Forecasting mindset: Helps teams connect SEO work to expected impact (useful for retainers and exec reporting)
- Unified reporting approach: Designed for agency workflows
- Strategy + execution alignment: Useful when you want reporting to feed next-month planning
What it’s good for
- Agencies that want to report “impact” not “activity”
- SEO teams that must justify budgets with forecasting and performance narratives
- Reporting stacks that need a structured approach to keywords/pages and business objectives
When it’s a good fit
Pick SEOmonitor if:
- You sell SEO as a program, not tasks,and you need reporting to prove program value
- Your clients demand business framing (“what will this do for pipeline?”)
- You want reporting connected to planning and prioritization
When it’s not a good fit
SEOmonitor may not be ideal if:
- You only need a dashboard shell (Looker Studio/Databox might be simpler)
- Your team already has a BI stack and prefers raw exports + custom modeling
- You’re looking for the cheapest option (SEO platforms tend to be paid)
How to use it
Step 1: Build reporting around SEO “portfolios.”
Instead of random keyword lists, group terms/pages into:
- product lines
- intent themes
- funnel stages
- regions
- priority opportunities
Step 2: Report “what moved” + “what we did” + “what we’ll do.”
Stakeholders don’t want charts, they want decisions:
- What’s working that we should scale?
- What’s broken that we should fix?
- What should we stop doing?
Step 3: Connect reporting to planning rituals.
A strong cadence looks like:
- weekly monitoring (alerts + triage)
- monthly executive summary (trend + narrative)
- quarterly strategy review (forecast + roadmap)
Key capabilities
- Rank tracking + portfolio grouping
- Reporting views designed for agencies
- Workflow elements that connect reporting to next actions
Pricing
SEOmonitor’s pricing starts at €99/month (Starter plan).
Free tier?
SEOmonitor doesn’t offer a free tier, but it does offer a free 14-day trial.
Downsides / limitations
- Not a general BI tool: It won’t replace a full analytics warehouse strategy.
- Learning curve: Teams need to adopt its planning/reporting philosophy to get full value.
- Integration needs: If you want unified “SEO + CRM + revenue” dashboards, you may still export or connect to a BI layer, especially for leadership-ready views on reporting AI visibility.
5. Semrush

What it does
Semrush is an all-in-one SEO and marketing platform that many teams already use for keyword research, competitive analysis, audits, and more. For reporting, Semrush offers reporting-related add-ons and tooling that can support white-labeling, scheduled delivery, and dashboard-style sharing.
Why teams use it
- One platform for many SEO needs: Research → execution → reporting happens in one ecosystem.
- Widely adopted: Easy to onboard clients and stakeholders because the brand is familiar.
- Competitive insights: Great for showing “why we lost/won” vs competitors in reporting narratives.
What it’s good for
- Teams that want a single vendor for SEO operations and reporting workflows
- Agencies that need standardized reporting components connected to Semrush research outputs
- Organizations that require competitive context inside reporting
When it’s a good fit
Choose Semrush if:
- Your reporting needs are tied closely to SEO ops (audits, keyword sets, competitive tracking)
- Your team already pays for Semrush, reporting becomes a “use what we have” win
- You want quick reporting exports to share insights without building dashboards from scratch
When it’s not a good fit
Semrush may not be the best if:
- Your primary need is client portals and multi-client provisioning (AgencyAnalytics is more purpose-built)
- You need heavy customization and blended metrics from multiple non-Semrush sources (BI tools may win)
- You want the simplest possible executive dashboard (Databox might be faster)
How to use it
Step 1: Decide what Semrush is responsible for.
A clean split:
- Semrush = research, audits, tracking, competitive insights
- BI/dashboard layer = unified KPI reporting (GA4, CRM, revenue, attribution)
Step 2: Standardize the “monthly pack.”
Include:
- visibility trend (and what drove it)
- top winners/losers pages
- competitive movement
- technical risks
- next-month priorities
Step 3: Pair Semrush insights with narrative.
Great reporting isn’t “here are charts.” It’s:
- “We’re winning on these themes.”
- “We’re losing on these intents.”
- “Here’s the plan and expected impact.”
Key capabilities
- Report add-ons that support branding/white-labeling and delivery
- Competitive and keyword intelligence features that produce actionable reporting narratives
Pricing
Semrush’s pricing starts at $139.95/month for its SEO Toolkit.
Free tier?
Semrush does offer a limited free account, and it also offers a free trial (often 7 days for many toolkits).
Downsides / limitations
- Can be overkill if you only need dashboards
- Reporting is not the only (or primary) product, you may still need a dedicated reporting layer for “one dashboard to rule them all”
- Blending with revenue/CRM data can require exports or BI connectors
What a “Great” SEO Dashboard Includes (KPIs clients actually understand)
Most SEO dashboards fail for one reason: they report SEO like an SEO, not like a business partner.
A great client dashboard answers three levels of questions:
1) Executive outcomes (the “why are we doing this?” layer)
These are the KPIs your CMO/CEO will care about:
- Organic-sourced pipeline / revenue (if trackable)
- Demo requests / signups from organic
- CAC payback contribution (advanced)
- Conversion rate from organic landing pages
- Brand demand trend (branded search growth, if relevant)
If you can’t connect directly to revenue, pick the closest “value proxy” and be transparent:
- qualified organic sessions (segment by intent)
- conversion events tied to product-qualified actions
2) SEO drivers (the “what’s causing outcomes?” layer)
These are the levers:
- Non-brand clicks (GSC)
- Rankings / visibility for priority themes
- CTR trends for top queries/pages
- Content velocity (pages shipped, refreshed, updated)
- Technical health highlights (indexation, key errors)
3) Diagnostic detail (the “what do we do next?” layer)
This is where SEO teams actually operate:
- Page groups: product pages vs blog vs comparison vs docs
- Query clusters by intent: problem-aware vs solution-aware vs competitor
- Top winners/losers
- Cannibalization or duplication warnings
- SERP feature presence (snippets, PAA, and now AI features)
The one metric rule: every KPI needs an owner and an action
If a KPI moves, your dashboard should make it obvious:
- who owns it
- what they’ll do next
This is why annotations and “next steps” blocks aren’t optional, they reduce churn.
AI Visibility Add-On: How to report AI Overviews, citations, and “share of answer”
Your Excel topic brief for this post calls out an ideal angle: “Exec dashboards that include AI visibility metrics.” That matters because leadership is increasingly asking variations of:
- “Are we showing up in AI answers?”
- “Why is Google sending fewer clicks?”
- Which sources does the AI trust, and are we one of them?
Here’s how to add AI visibility without turning your dashboard into science fiction.
1) Track Google AI Overviews presence (simple operational layer)
At minimum, report:
- % of priority queries that trigger AI Overviews
- Whether your brand/domain is cited (when citations are available)
- Trendline: increasing/decreasing presence over time
Even if your tool stack is imperfect, consistent sampling beats nothing.
2) Track citations and mentions (trust signals)
Report:
- citation count (how often you’re referenced)
- top cited URLs (what content is earning trust)
- top competitor citations (who’s being recommended instead)
This mirrors classic SEO thinking: it’s like backlinks/mentions, except inside AI answers.
3) Define “Share of Answer” (exec-friendly)
A pragmatic definition:
- Out of a set of agreed prompts/queries, how often does AI include your brand/product as a recommended option?
You can then visualize:
- share-of-answer trend
- competitor share shift
- prompt clusters where you’re strong/weak
4) Put AI visibility in the same dashboard as classic SEO
This is important: executives don’t want a separate “AI report.”They want one view that answers: Are we winning visibility, and is it turning into business results?
A simple framework to choose the right tool (Agency vs in-house vs hybrid)
Use this decision framework:
If you’re an agency managing multiple clients
- Choose AgencyAnalytics if your bottleneck is scale, templating, portals, and white-labeling.
- Choose SEOmonitor if clients demand forecasting, business framing, and program-level reporting.
- Use Looker Studio if you have custom needs and want a reusable BI-style template.
If you’re in-house (one brand, lots of stakeholders)
- Choose Looker Studio if you want flexibility and cross-team dashboards.
- Choose Databox if you need to clean exec dashboards quickly and want alerts/cadence.
- Use Semrush if your SEO ops already live there and reporting is an extension of your workflows.
If you’re hybrid (agency + internal analytics stack)
- Use Semrush/SEOmonitor for SEO ops + insights
- Use Looker Studio for unified KPI dashboards and governance
- Use Databox for exec-ready dashboards and recurring operating cadence
Common pitfalls (and how to avoid “pretty but pointless” dashboards)
Pitfall #1: Reporting rankings without business context
Fix: Always pair rankings with:
- page-level conversions
- query intent grouping
- pipeline impact proxies
Pitfall #2: Too many metrics (analysis paralysis)
Fix: Put 6–10 KPIs at the top and keep the rest behind drilldowns.
Pitfall #3: No segmentation (everything averages out)
Fix: Segment by:
- brand vs non-brand
- product line
- content type
- market/region
- funnel stage
Pitfall #4: No decisions attached
Fix: Every report ends with “next actions,” owners, and deadlines.
Pitfall #5: Ignoring AI visibility shifts
Fix: Even if measurement is imperfect, add:
- AIO presence sampling
- citation/mention tracking (where possible)
- “share of answer” trend for priority prompts
What are the best SEO reporting tools for agencies?
If you run an agency, “best” usually means fast to deploy, repeatable across clients, and easy to explain, not necessarily the tool with the most features. The sweet spot is a system that lets you (1) standardize reporting, (2) automate delivery, and (3) still add a clear narrative so clients understand impact.
The top options (by agency use case)
1) AgencyAnalytics; best for scalable, white-label client reporting
If you manage many clients and need templates, portals, and consistent monthly packs, this is the most “agency-native” choice. It’s built around the problems agencies actually have: onboarding multiple accounts, keeping recurring reports consistent, and reducing reporting time.
2) Looker Studio; best for custom dashboards and “one template for all clients”
Looker Studio is excellent when you want full control and you have the time/skills to build a reusable dashboard template. It’s ideal for agencies that:
- want a unique reporting style (not cookie-cutter),
- need to blend many sources (GA4 + GSC + CRM),
- or have clients with complex segmentation needs.
3) Databox; best for executive-style dashboards and cross-channel reporting
If your agency reports across SEO + paid + lifecycle (and your clients want a clean exec view), Databox is strong for fast setup and leadership-friendly visualization.
4) SEOmonitor; best for agencies that sell strategy and forecasting
If your clients push for “what will this do for the pipeline?” and you need program-level reporting tied to planning, SEOmonitor’s forecasting mindset can help you show value beyond rankings.
5) Semrush; best if you already use it heavily for SEO ops
Semrush can work well when your reporting is an extension of your existing Semrush workflows (audit, tracking, research). Many agencies pair it with Looker Studio or AgencyAnalytics rather than using it as the only reporting layer.
A simple agency rule of thumb
- 10+ clients, white-label, repeatability matters most → AgencyAnalytics
- Custom needs + BI mindset → Looker Studio
- Exec dashboards fast + multi-channel → Databox
- Forecasting + program narrative → SEOmonitor
- All-in-one SEO workflows → Semrush (usually with another dashboard layer)
What’s the best tool for white-label SEO dashboards?
White-label dashboards matter when clients want a “portal experience” that looks like your agency, not a vendor dashboard and not a messy spreadsheet export.
Best overall: AgencyAnalytics
It’s designed for agency reporting: client portals, templates, automated reports, and branding. The key advantage is that white-labeling is not an add-on afterthought, it’s baked into the workflow.
When Looker Studio can still win for white-label
Looker Studio can absolutely be used in a white-label-ish way, especially if you:
- embed dashboards in your client portal,
- control the sharing permissions tightly,
- and create a consistent branded template.
But it typically requires more setup and governance than an agency-native tool.
White-label tool checklist (use this before you commit)
A tool qualifies as “white-label ready” if it can do most of these cleanly:
- Client portal login access (or embed options)
- Agency branding (logo/colors)
- Client-level permissions (no cross-account leakage)
- Automated recurring delivery (monthly PDFs or links)
- Template duplication across accounts
- Easy onboarding/offboarding workflows
If you’re scaling, don’t underestimate onboarding. White-label reporting fails when your team spends hours “setting up one more client.”
Can I automate SEO reports to clients weekly/monthly?
Yes, and you should. The key is to automate the repeatable reporting layer while keeping the insight layer human.
What to automate (the “machine” layer)
These are best automated:
- dashboard refreshes
- weekly KPI snapshots (traffic, clicks, conversions, rankings)
- alerts (major dips/spikes)
- top movers (winning/losing pages/queries)
- technical issue summaries (core errors, indexation anomalies)
What to keep human (the “strategy” layer)
Clients stay longer when they get interpretation, not just data:
- “What changed and why?”
- “What we did this month”
- “What we’ll do next month”
- “What we need from you (dependencies)”
Recommended automation cadence (agency-friendly)
Weekly (5–10 minutes to review + send)
Send a short update:
- 3 KPI trends
- 1–2 insights (“why this moved”)
- next action(s)
Monthly (30–60 min review call)
Deliver a full pack:
- executive summary dashboard
- channel/segment drilldowns
- roadmap + priorities for the next month
- deliverables recap (what shipped)
Automation setup patterns (that actually work)
Pattern A: Agency platform automation (fastest)
- Use AgencyAnalytics-style templates
- Auto-send monthly packs
- Add a short custom summary each month
Pattern B: BI dashboard + email workflow (most flexible)
- Looker Studio dashboard
- Scheduled export/email (or PDF link delivery)
- “insight memo” written separately
Pattern C: Exec dashboard tool (best for leadership)
- Databox dashboards + alerts
- Monthly narrative wrap-up from your team
Automation isn’t about removing humans, it’s about removing busywork.
What should an executive SEO dashboard look like?
An executive dashboard is not an SEO tool. It’s a decision tool. It should answer in 5 minutes:
- Are we growing qualified demand?
- Is that demand turning into pipeline/revenue?
- What’s driving change?
- What are the next priorities and risks?
The ideal executive SEO dashboard layout (1-page view)
Section 1: Outcomes (top row)
- Organic conversions (demo/signups/leads)
- Organic-sourced pipeline/revenue (if tracked)
- Conversion rate from organic landing pages
Section 2: Demand + visibility (second row)
- GSC clicks (total + non-brand if possible)
- Impressions trend (demand/visibility proxy)
- Visibility / rankings summary (for priority themes)
Section 3: What changed (third row)
- Top 5 landing pages driving growth (and decline)
- Top query clusters trending up/down
- CTR highlights (wins/losses)
Section 4: Context + actions (bottom row)
- annotations: releases, content shipped, tracking changes, algorithm turbulence windows
- next 3 priorities (with owners)
- top 3 risks/blocks (technical, resource, approvals)
What to exclude from exec dashboards
Executives don’t need:
- 50 keywords
- technical audit screenshots
- cannibalization tables
- deep SERP feature breakdowns
Keep deep diagnostics in the operator dashboard; exec dashboards stay outcome-driven.
How do you QA dashboards so numbers match across tools?
This is one of the biggest reporting pain points. You’ll never get perfect alignment (different tools define sessions/users differently), but you can create consistency and trust.
First: align on “source of truth” rules
Define:
- GA4 is the source for on-site behavior + conversions
- GSC is the source for Google organic clicks/impressions/CTR
- Rank tracker is the source for ranking position/visibility
- CRM is the source for pipeline/revenue
Then: don’t compare metrics that aren’t comparable (example: GA4 sessions ≠ GSC clicks).
Monthly QA checklist (use this every time)
1) Time range and timezone check
- confirm date range is identical across tools
- confirm timezone settings (GA4 vs dashboards)
2) Attribution definitions
- confirm channel grouping (Organic Search definition)
- confirm UTM/campaign rules didn’t change
- confirm conversion events didn’t get renamed
3) Sampling / thresholds
- verify whether reports are sampled (some tools or exports can sample)
- validate if thresholds or privacy settings in GA4 affect reporting
4) Filters
- confirm hostname filters, internal traffic filters
- confirm country/device segments match across tools
- confirm brand vs non-brand classification rules
5) Spot-check “known pages”
Pick 3–5 important landing pages and check:
- GA4 organic sessions trend direction
- GSC clicks trend direction
- Do they move similarly? (They won’t match, but direction should make sense.)
6) Rank tracking integrity
- validate tracked keyword list hasn’t changed unexpectedly
- confirm location/device settings
- confirm competitors and SERP settings unchanged
How to prevent future mismatches
- Use a standardized template per client
- Maintain an “annotations log” for tracking changes
- Create a “definitions” section in every report (“how we calculate KPIs”)
- Lock key filters/segments so they can’t be accidentally edited
Trust is built through consistency and transparency, not perfect metric matching.
What’s the simplest dashboard stack for a small agency?
If you’re small, the goal is minimum setup + maximum repeatability.
The simplest “good enough” stack (low cost, high leverage)
Core tools
- GA4 for sessions, engagement, conversions
- Google Search Console for queries, pages, clicks, impressions
- Looker Studio for the client dashboard (template reused across accounts)
- A lightweight rank tracker (or export from your existing SEO suite)
Optional
- A Google Sheet as a “control center”:
- monthly deliverables checklist
- annotations log
- KPI notes and narrative summary
Why this stack works
- It’s cheap
- It’s standardized
- It scales to 10–30 clients if your template is solid
- You can upgrade later (AgencyAnalytics / Databox) without rebuilding your entire reporting logic
If you want an even simpler (agency-native) option
If you’re willing to pay to reduce setup time, choose AgencyAnalytics early because it reduces the cost of reporting labor and client servicing.
How should SEO deliverables be packaged into client-ready monthly reports?
A “client-ready” monthly report should feel like a product: consistent structure, clear outcomes, and a plan.
The best monthly report format (agency-tested)
Page 1: Executive Summary
- top outcomes (conversions/pipeline proxy)
- what changed vs last month
- why it changed (drivers)
- what we’re doing next (priorities)
- what we need from the client (dependencies)
Page 2–3: KPI Dashboard
- organic sessions (segmented)
- GSC clicks/impressions/CTR
- rankings/visibility for priority themes
- top landing pages (wins/losses)
Page 4: Work delivered (inputs)
Group deliverables into categories:
- content shipped (new pages, refreshes)
- technical fixes (indexation, CWV, structured data)
- on-page improvements (titles, internal linking, CRO fixes)
- strategic initiatives (topic clusters, competitive pages)
Page 5: Opportunities + roadmap
- top 3 opportunities
- top 3 risks
- next-month priority list with estimated impact
Packaging rules that reduce churn
- Always lead with outcomes, not activities
- Make the report skimmable: headings, bullets, callouts
- Include a “what we need from you” section (approvals, dev support, SME input)
- Keep a consistent format month to month (clients trust what they recognize)
FAQs
If you want speed and scale with client provisioning, templates, and white-label reporting, AgencyAnalytics is commonly the best fit for agencies. If you also need forecasting-style narratives and program reporting, consider SEOmonitor as a more strategy-linked option.
Looker Studio is the most common free starting point for SEO dashboards because the self-service tier is no-cost and supports broad connectivity and customization.
Use Looker Studio when you need maximum customization and you can invest time into modeling and templates. Use Databox when you want executive-ready dashboards fast, with a cleaner “out-of-the-box” experience and automated cadence features.
At minimum: organic conversions (or a value proxy), organic sessions, GSC clicks, non-brand query trend, top landing pages, and a visibility/rank summary. Then add context with annotations and next steps. If AI visibility matters, add AI Overviews presence and citations/mentions tracking where possible.
A strong baseline is weekly short updates (movements + actions) and a monthly dashboard review with narrative and priorities. Quarterly reviews are best for strategy resets, forecasting, and budget justification.
Yes, white-labeling is easiest in agencyAgencyAnalytics, while Looker Studio can also be branded depending on your setup and sharing method.
Treat AI Overviews like a SERP feature: track presence on a defined set of priority queries, note citations/mentions where visible, and trend it over time. Pair it with classic metrics (clicks, conversions) to show the business impact of visibility shifts.
📋 Get Listed / Advertisement
We update this guide monthly. Want your tool featured? Contact: [email protected].


