
Across nine industries, Google AI Overviews showed up on roughly 48% of tracked queries by early 2026, up from about 31% a year earlier, per BrightEdge's tracker as compiled by Quick SEO.
When half your buyers' searches get answered before a single click, the question stops being "where do I rank?" and becomes "do the answer engines mention me, and what are they saying?"
Most AI visibility dashboards hand you a dozen numbers and no priorities. This guide cuts that list down to the metrics that actually predict pipeline, shows you exactly where each one lives inside Semrush using our own domain as the worked example, and explains how to read each reading like an operator instead of a tourist.
You will leave knowing which KPIs to watch weekly, which to ignore, and how to turn any of them into a decision.
We will move in the order a buyer journey moves.
First what AI search visibility is and why it matters, then the metrics themselves one by one, then how they stack up against classic SEO, and finally how to audit your own brand and tie every number to revenue.
Table of Contents
What Is AI Search Visibility?
AI search visibility is how often, how prominently, and how accurately your brand shows up in AI-generated answers across ChatGPT, Google AI Overviews, Perplexity, Gemini, and Claude. Think of it as the AI counterpart to a Google ranking, only the surface is a synthesized answer rather than a list of blue links.
It splits into two things people constantly conflate.
A mention names your brand in the answer text. A citation attaches a clickable link to your page. As Data-Mania's 2026 B2B SaaS benchmark report puts it, a citation carries more weight because it generates referral traffic and signals to the model that your content is a trusted source.
Why does the distinction matter so much? Because you can be famous and invisible at the same time. An engine can describe your category accurately, name three competitors, and never link or name you, which means you influenced nothing and captured no traffic. Measuring visibility well means tracking both layers, then watching how they move together.
The entities that make up this discipline are worth naming up front, since each one becomes a metric later in this guide.
The core entity is your brand.
The related entities are the prompts buyers ask, the competitors who share your answer space, the engines that generate the answers, and the pages the engines cite.
Why AI Search Visibility Metrics Matter Now
AI visibility metrics matter now because the buying decision has moved inside the answer, and traditional rank tracking cannot see that surface. Buyers compare tools, read summaries, and form a shortlist before they ever touch a website, so a brand that wins the answer wins the consideration set early.
The prevalence data makes the shift concrete.
Conductor's analysis of 21.9 million queries, as reported by Digital Applied, found AI Overviews triggering on 25.11% of Google searches in Q1 2026, while the Semrush AI Overviews study of more than 10 million keywords tracked prevalence settling near 16% by November 2025 after a mid-year peak above 24%.
The exact number depends on the keyword set, but the direction is not in dispute.
Two more shifts raise the stakes for SaaS specifically.
The composition of AI Overview queries has tilted from informational toward commercial and navigational, which are exactly the comparison and brand searches a SaaS buyer runs. And zero-click behavior, although it may be leveling off, is still the norm; Datos' Q1 2026 State of Search report, summarized by Quick SEO, measured US zero-click rates easing from 24.5% in December 2025 to 22.4% in March 2026, which is a softening of pressure, not a reversal of it.
‼️ Here is the operator takeaway. If a quarter to a half of your category's searches now resolve inside an answer, and that answer increasingly covers commercial intent, then not measuring whether you appear there is a blind spot sitting directly over your pipeline. The brands that instrument this early get a clean baseline before the surface gets more crowded.
Which AI Search Visibility Metrics Actually Matter?
The metrics that actually matter are the ten that map to revenue, not the dozens that map to dashboards. Below is the full set, what each one measures, why it earns a place, and where it lives inside Semrush so you can pull it yourself.
| AI Visibility Metric | What It Measures | Why It Matters | Where It Lives in Semrush |
|---|---|---|---|
| AI Visibility Score | A 0 to 100 benchmark of how often you appear in AI answers versus rivals. | A single trend line to watch and report. | Visibility Overview |
| Share of Voice | Your share of category mentions against the competitive set. | Tells you who owns the category answer. | Brand Performance |
| Mentions | The count of prompts where your brand appears in answers. | Raw reach across the query space. | Visibility Overview |
| Citations and Cited Pages | How often, and on which URLs, engines link to you. | The layer that actually drives referral traffic. | Visibility Overview |
| Sentiment | Whether AI frames you positively, neutrally, or negatively. | A bad frame is worse than no mention. | Brand Performance (Perception) |
| Distribution by LLM | Your share split across ChatGPT, Gemini, Perplexity, and others. | Shows which engines you are winning or missing. | Visibility Overview |
| Prompt Coverage | The share of buyer prompts where you show up at all. | Reveals topical gaps in your answer presence. | Brand Performance (Questions) |
| Recommendation Rank | Your average position within the generated answer. | Being named first shapes the shortlist. | Brand Performance |
| AI Overview Presence | Which keywords trigger an AIO and whether it links to you. | Connects AI visibility to your existing SERP. | Position Tracking |
| AI Referral Conversion | Sessions from AI engines and how well they convert. | The KPI that ties visibility to pipeline. | My Reports (GA4 AI referral filters) |
A quick way to keep this list honest is to sort every metric into one of three buckets.
- Reach metrics tell you how widely you appear, namely mentions, prompt coverage, and distribution.
- Quality metrics tell you how well you appear, namely recommendation rank, sentiment, and cited pages.
- Outcome metrics tell you whether any of it pays, namely AI referral traffic and its conversion rate.
The mistake most teams make is living in the reach bucket because those numbers are biggest and easiest to grow. Contently's GEO-for-SaaS guidance makes the corrective point cleanly, namely that citation share of voice, AI referral traffic, conversion from that traffic, and which pages get cited are the metrics that tie directly to pipeline, unlike rankings.
We will demonstrate each one against our own domain next, starting with the headline number.
1. AI Visibility Score: What It Is and What Counts as Good
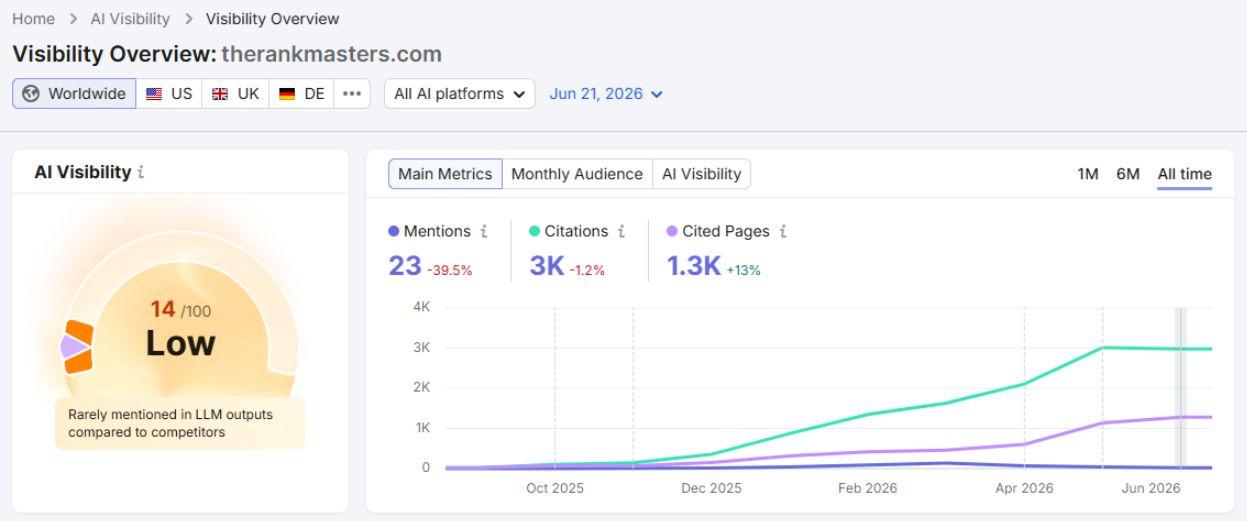
Your AI Visibility Score is a single 0 to 100 number showing how often your brand appears in AI-generated answers compared with competitors, and it is the fastest way to baseline where you stand. It is the metric to put on a dashboard and watch weekly, because one trend line is easier to govern than ten.
Pulling it on your own domain takes under a minute.
- Open Semrush and go to the AI section in the left navigation.
- Click Visibility Overview.
- Enter your domain, for example therankmasters.com.
- Set the date range you want to baseline, such as the last 30 days.
- Read the AI Visibility gauge at the top of the report.
So what is a good score? Use real benchmarks, not vibes. Data-Mania's 2026 SaaS benchmark study found top SaaS brands scoring around 84 out of 100 while the category median sits near 62, which gives you a clean way to read your own gauge.
| Score Band | What It Means | The Move It Drives |
|---|---|---|
| 80 to 100 | Category leader presence. | Defend cited pages; expand into adjacent prompts. |
| 62 to 79 | Mid-pack, room to climb. | Close the highest-intent prompt gaps first. |
| Below 62 | Under the median. | Treat AI visibility as a build, not a tune-up. |
One caveat worth saying out loud, because Semrush itself is honest about it. The score is modeled from synthetic prompts and clickstream estimates rather than exact server-side counts, so treat it as a reliable trend indicator rather than an absolute truth.
Watch the direction and the gap to competitors, and you will not be misled by a decimal point.
Want to follow along on your own domain? Start a 14-day Semrush One trial and pull your Visibility Overview before you read the next metric.
2. AI Share of Voice: How to Measure It
AI share of voice is your slice of all category mentions against your competitive set, and it is the metric that tells you who actually owns the answer in your space. Where the Visibility Score is absolute, share of voice is relational, so it moves the moment a competitor gains or loses ground.
The calculation is simple enough to sanity-check by hand. Per Data-Mania, share of voice equals your citations divided by all citations in the category, times 100. In Semrush you do not compute it manually, you read it from the Brand Performance suite.
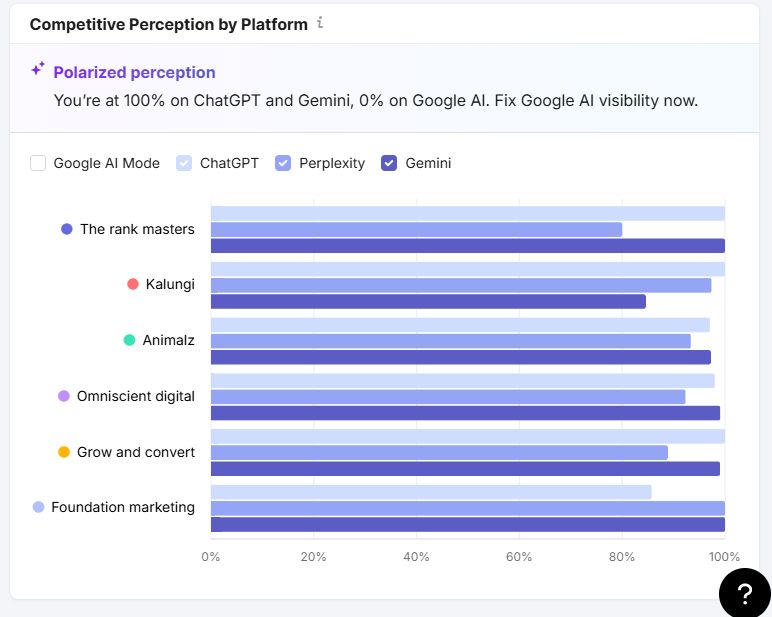
- Open the AI section and click Brand Performance.
- Land on the main dashboard and find the Share of Voice vs Sentiment chart.
- Confirm your competitive set is correct, then read your share against the field.
- Switch to the Perception report to see how that share trends over time.
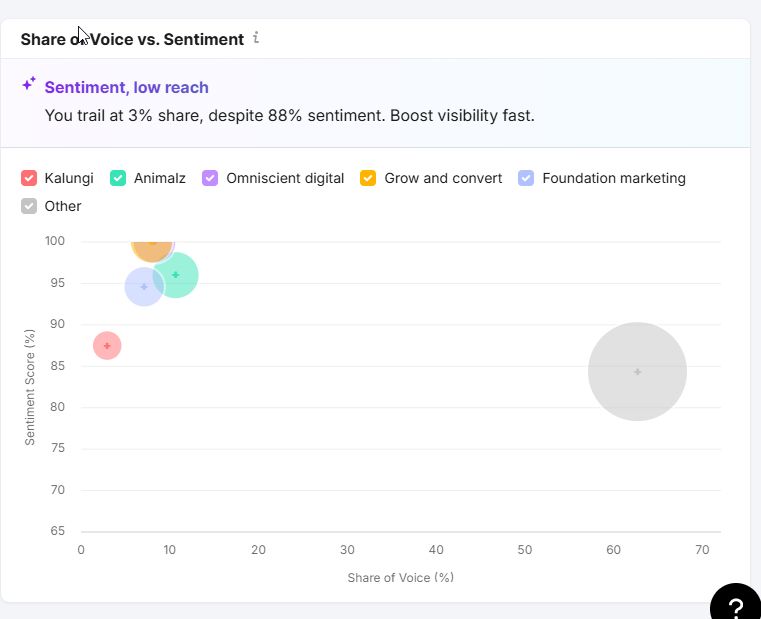
‼️ How high should you aim? AI search expert Cassie Clark frames the realistic target as the 40 to 70 percent band, because, in her words, it "avoids false precision while still giving teams a clear, actionable target." Her read is that below 40 percent your visibility exists but your influence is limited, 40 to 70 percent means you meaningfully shape the answer, and above 70 percent is possible but often unstable unless the category is narrow.
| Share of Voice Band | How to Read It | The Decision It Drives |
|---|---|---|
| Below 40% | Present but not influential. | Win more prompts before optimizing tone. |
| 40% to 70% | You shape the category answer. | Defend, then expand into competitor prompts. |
| Above 70% | Dominant but often fragile. | Protect freshness; expect mean reversion. |
There is real strategy hiding in this single number, which is why it is the one many practitioners watch first. A GEO audit framework from AI Labs Audit argues that share of voice is the single best metric to track over time. We agree it is the best single metric, with one caution, namely that a high share built on a neutral or negative frame is not the win it looks like, which is exactly why the next section pairs it with sentiment.
Curious where you sit against your two closest rivals? Try the AI Visibility Toolkit free for 14 days and benchmark your share of voice against them.
3. Mentions vs Citations: Why the Difference Drives Different Work
Mentions and citations measure two different things, and conflating them is the most common reporting error in AI visibility. A mention is the count of prompts where your brand appears in an answer, while a citation is an actual link to one of your pages, which is the part that sends traffic.
This gap is not a rounding error, it is a strategic signal. Semrush has flagged a "mention-source divide," where fewer than one in five brands are both mentioned in AI answers and cited as a source, which means most brands are being talked about without being credited. If that is you, the fix is content and structure work on the exact pages that should be earning the link, not more brand-awareness spend.
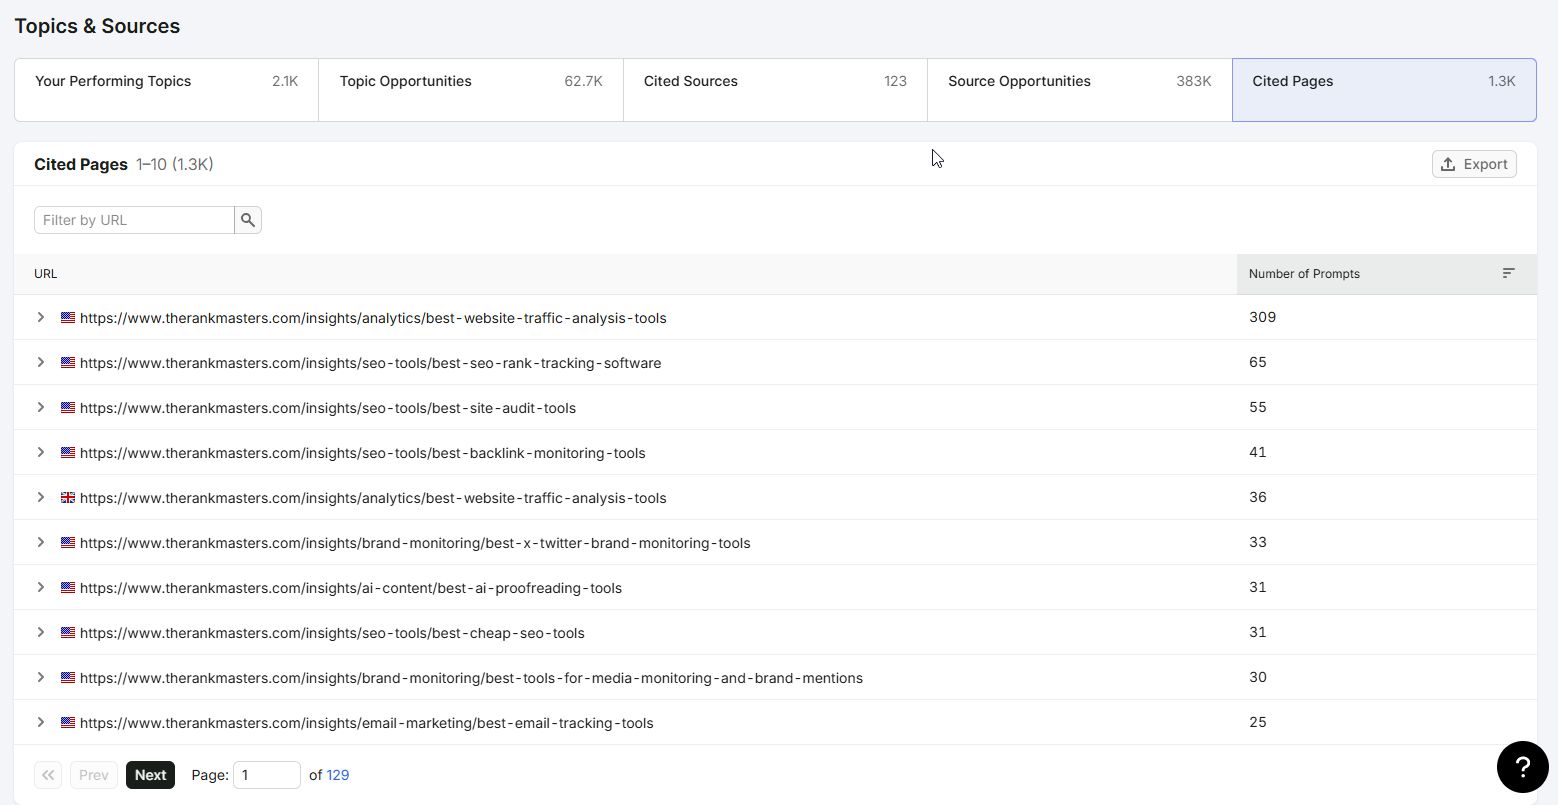
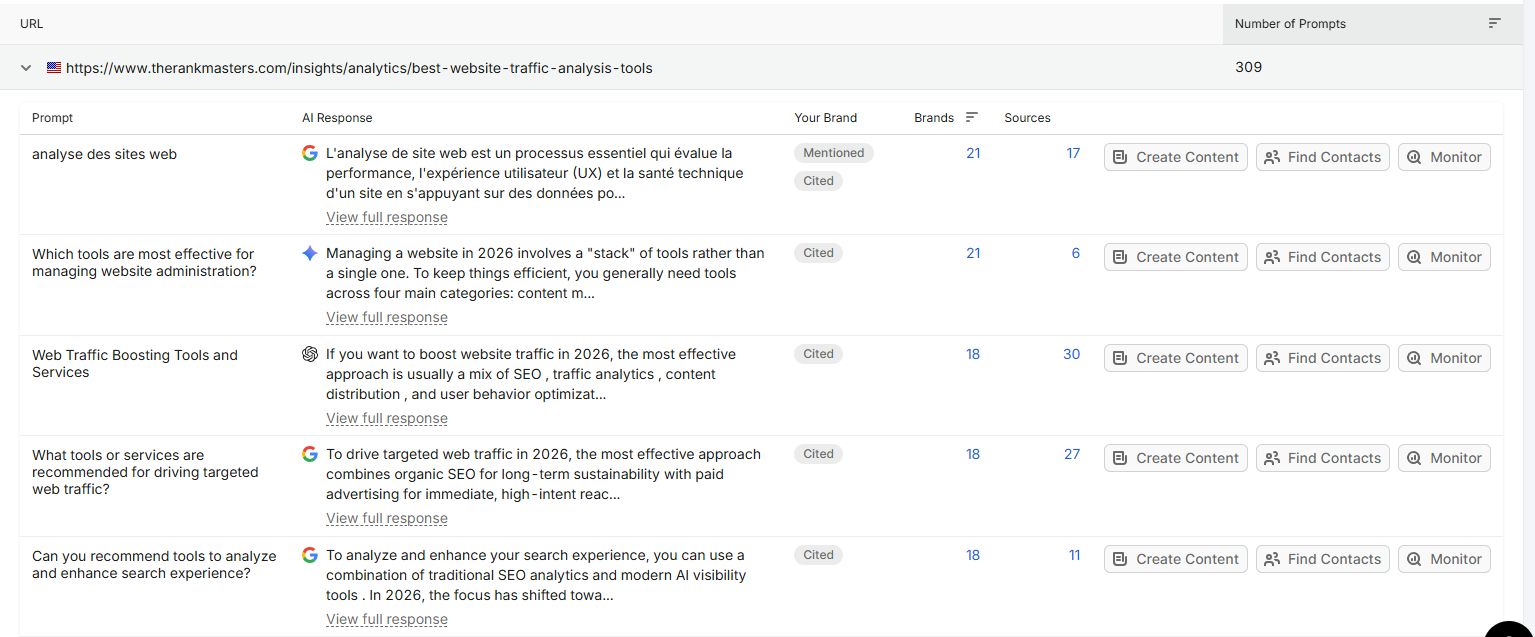
Here is how to separate the two inside Visibility Overview.
- Open AI > Visibility Overview and enter your domain.
- Read the Mentions figure for total prompts where you appear.
- Scroll to the Cited Pages and Citations modules.
- Compare your mention count against your cited-page count to size the divide.
- Note which URLs are earning citations and which money pages are absent.
| Signal | What You See | What It Tells You |
|---|---|---|
| High mentions, low citations | Named often, linked rarely. | Your pages are not extractable or authoritative enough yet. |
| Low mentions, high citation rate | Rarely named, but linked when you are. | Strong pages, thin topical coverage. Add prompts. |
| Both rising together | Reach and credit growing in step. | Your content system is compounding. Keep going. |
Read this way, the two numbers tell you which lever to pull. A mention problem is a coverage and authority problem you solve with more and better content across the prompt space. A citation problem is a page-level structure problem you solve by making specific URLs easier to quote and link. Knowing which one you have saves you from optimizing the wrong thing for a quarter.
Want to see your own mention-to-citation gap on real pages? Open Semrush One and pull this report on your domain before your next content sprint.
4. How to Measure Sentiment in AI Answers
Sentiment measures whether AI engines describe your brand positively, neutrally, or negatively, and it is the metric that keeps share of voice honest. A model can mention you constantly and still steer buyers elsewhere, so frequency without framing is an incomplete picture.
The reason sentiment ranks higher than most teams assume is brutal but clarifying. As the AI Labs Audit GEO framework notes, a model recommending a competitor over you is functionally worse than not mentioning you at all, because it actively redirects the buyer. So a neutral mention next to a glowing competitor write-up is a quiet loss, even though it counts as visibility.
You track this in the Perception report.
- Open AI > Brand Performance.
- Click into the Perception report.
- Read your positive, neutral, and negative split.
- Trend it over the available window to see if perception is improving or slipping.
- Cross-reference the Narrative Drivers report to see which sources shape the framing.
What is a healthy reading? A useful external reference point is the share of mentions that land positive or neutral rather than negative. Semrush's own published case study reported a brand reaching 97% positive or neutral sentiment, which is a sensible ceiling to aim toward rather than a number to expect on day one. If a meaningful slice of your mentions skews negative or simply absent from recommendation moments, that is your first content priority, because it is the cheapest to fix and the most expensive to ignore.
Want to see how the engines are framing your brand right now? See your own sentiment split on a free 14-day Semrush One trial and check it against your closest competitor.
5. How to Track Visibility Across ChatGPT, Gemini, and Perplexity
Distribution by LLM measures how your visibility splits across ChatGPT, Gemini, Perplexity, Claude, and Google's AI surfaces, and it matters because no single engine is the whole market. Winning ChatGPT and ignoring the rest leaves real buyers uncovered, especially as the field fragments.
The market has genuinely de-consolidated, which changes where you place your bets. Goodie's longitudinal AI search traffic report measured B2B AI referral share over March and April 2026 at roughly 62.6% for ChatGPT, 18.5% for Claude, 10.6% for Gemini, and 7.3% for Perplexity, a far cry from ChatGPT's near-total dominance a year earlier.
| AI Engine | Approx. Share of B2B AI Referrals (Mar to Apr 2026) | What It Means for Coverage |
|---|---|---|
| ChatGPT | ~62.6% | Non-negotiable. Most of your buyers start here. |
| Claude | ~18.5% | Now too large to skip. |
| Gemini | ~10.6% | Rising; tied to Google's surfaces. |
| Perplexity | ~7.3% | Rising; tied to Google's surfaces. |
Distribution also matters because the engines behave differently, not just at different volumes. Lantern's February 2026 citation analysis found ChatGPT citing product pages at 20.1%, roughly fifty times Perplexity's 0.4%, which means the page types that win one engine can be nearly irrelevant on another. A single blended score hides that, so you read the split.
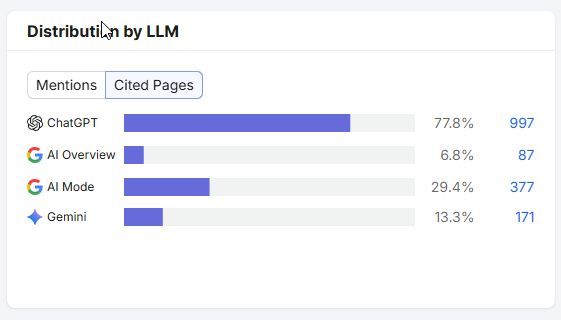
Here is the pull inside Semrush.
- Open AI > Visibility Overview for your domain.
- Scroll to the Distribution by LLM module.
- Read your share on each platform side by side.
- Flag any engine where your share badly trails your overall average.
The decision this drives is allocation. If you are strong on ChatGPT but invisible on Perplexity, and Perplexity sends you unusually high-intent research traffic, that gap is a roadmap, not a footnote. Tracking the split keeps you from declaring victory on one engine while a competitor quietly owns the other three.
Want to see your own per-engine split? Spin up a 14-day Semrush One trial and check your LLM distribution across the platforms your buyers actually use.
6. How to Measure Prompt Coverage and Recommendation Rank
Prompt coverage and recommendation rank measure the depth of your presence, namely how many buyer prompts you appear in and where you land inside each answer. Reach tells you that you show up; these two tell you whether you show up where it counts and how prominently.
Both belong to a layered KPI model rather than a single headline. LSEO's 2026 measurement guide lays out a stack that includes Answer Inclusion Rate, Citation Rate, Recommendation Rate, and Prompt Coverage, and the useful idea inside it is that presence and prominence are not the same axis. You want to know both whether you are in the answer and how central you are to it.
You read prompt-level detail in the Questions report.
- Open AI > Brand Performance.
- Click into the Questions report.
- Review the specific prompts where you and competitors appear.
- Sort for high-intent, comparison, and "best [category]" prompts.
- Note where a competitor appears and you do not, prompt by prompt.
The reason prompt coverage is so actionable is that it converts a vague goal into a list. Instead of "improve AI visibility," you get "win these eleven comparison prompts where a competitor is named and we are not," which is something a content team can actually execute against. Recommendation rank then tells you whether the prompts you do win place you first or bury you fourth, which is the difference between shaping a shortlist and decorating it.
Want your own prompt list, mapped to competitors? Start your 14-day Semrush One trial and track a prompt set for your category.
7. How to Measure AI Overviews Visibility
AI Overviews visibility measures which of your keywords trigger a Google AI Overview, whether that Overview links to you, and where you sit, and it connects your AI presence back to the SERP you already track. This is the bridge metric, because it lives where classic SEO and AI visibility overlap.
The surface keeps growing and shifting, which is why you track it as a moving target rather than a one-time check.
Beyond raw prevalence, the structure of these answers matters, since SE Ranking's 2025 analysis found most AI Overviews citing between 6 and 14 sources, with longer answers pulling in many more. That tells you there is room in most answers for several brands, so being source seven is still worth winning.
Semrush tracks this through Position Tracking with multitargeting.
- Open Position Tracking and add your keywords and prompts.
- Enable multitargeting so Google and AI platforms show side by side.
- Filter to AI Overviews or SERP features.
- Read which tracked terms trigger an AIO and whether it links to you.
- Compare the same term across Google and ChatGPT in one view.
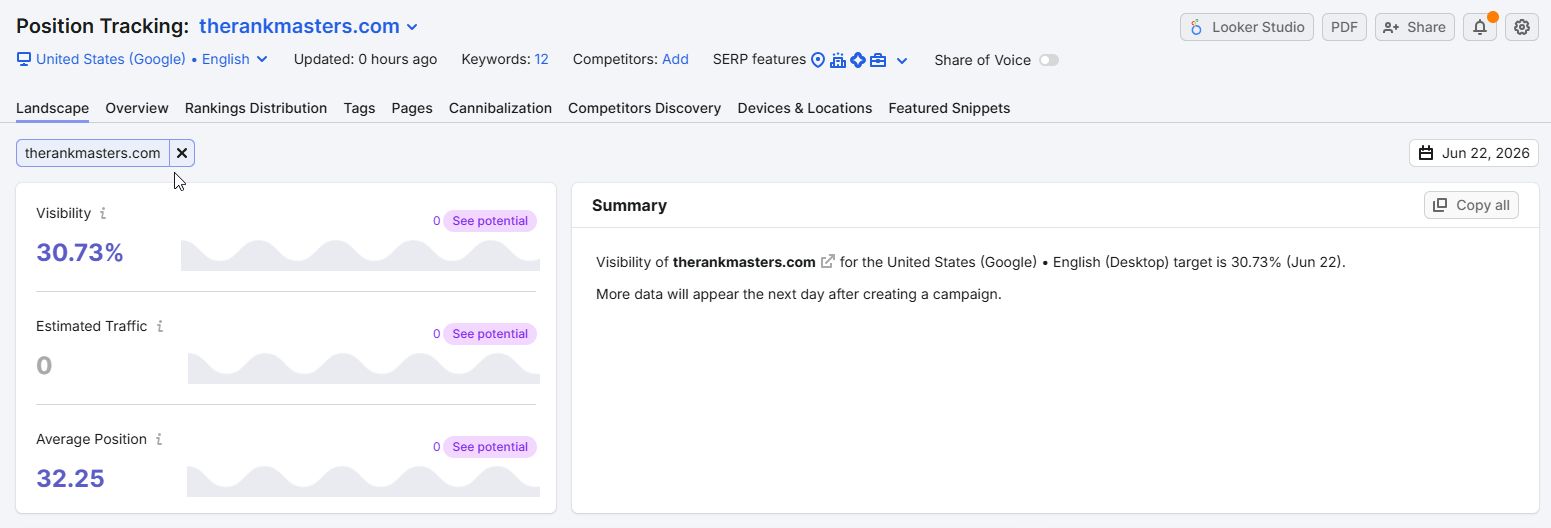
Reading this report well means watching two things at once. First, the spread of your keywords that now trigger an AIO, which tells you how much of your SERP footprint has gone conversational. Second, whether those Overviews actually link to you, because triggering an Overview that cites a competitor is a loss dressed up as coverage. Track both and you will see the AI surface and your classic rankings as one connected system.
Want to map your keyword set across both surfaces? Run Semrush One free for 14 days against a competitor and compare who the AI Overviews actually cite.
8. AI Referral Traffic and Conversion: The Revenue KPIs
AI referral traffic and its conversion rate are the outcome metrics, namely the sessions AI engines send you and how well those visitors convert. Every metric above is a leading indicator; this is the one that shows up in pipeline, which is why it belongs on the executive view.
The headline is that AI traffic is small but unusually high-quality, especially for SaaS. A widely cited Seer Interactive case study reported by ALM Corp found ChatGPT-referred traffic for a B2B software client converting at 15.9% against organic search's 1.76%, a gap Seer attributes partly to buyers using ChatGPT for deep vendor research before they ever click. The volume is tiny, so do not reallocate your whole budget, but the intent signal is loud.
| Source | Finding | Reading For SaaS |
|---|---|---|
| Seer Interactive (B2B software, via ALM Corp) | ChatGPT 15.9% vs organic 1.76% conversion. | AI visitors arrive pre-qualified. |
| First Page Sage (160+ companies, 2026) | ChatGPT traffic consistently outconverts traditional SEO. | The pattern holds across industries. |
| Lantern (Feb 2026) | Conversion measures fit; revenue per session measures quality. | Track both, not just one. |
That breadth matters, because one case study is an anecdote and a pattern is a trend. First Page Sage's 2026 study across more than 160 companies found ChatGPT-influenced traffic converting at consistently higher rates than traditional SEO, which moves the high-intent finding from "interesting" to "reliable enough to plan around."
How do you instrument it? Connect your GA4 data to Semrush My Reports and filter for AI referral traffic, which lets you fold AI sessions and conversions into the same scheduled reporting you already run. On the GA4 side, an AI Assistant channel now helps capture ChatGPT, Gemini, and Claude, though it still misses some engines, so treat your number as directional.
As Lantern frames the split, "conversion rate tells you if AI search is working," while revenue per session tells you whether the visitors are the right fit.
The decision this drives is whether to keep investing. If your AI referral conversion runs multiples above organic, even at low volume, the unit economics argue for closing your visibility gaps faster, because each new cited page on a money topic compounds into pipeline rather than just traffic.
This is also where a tool stops and a strategist starts. A dashboard like Semrush will hand you the numbers, namely your score, your cited pages, your sentiment, and your competitor gaps, but it will not tell you which of them to act on first or how to turn them into a plan.
That interpretation layer, reading the metrics and mapping your ICP's buying journey to the SEO and AEO content that wins it, is the work The Rank Masters does for B2B SaaS teams, so visibility becomes revenue rather than a vanity score.
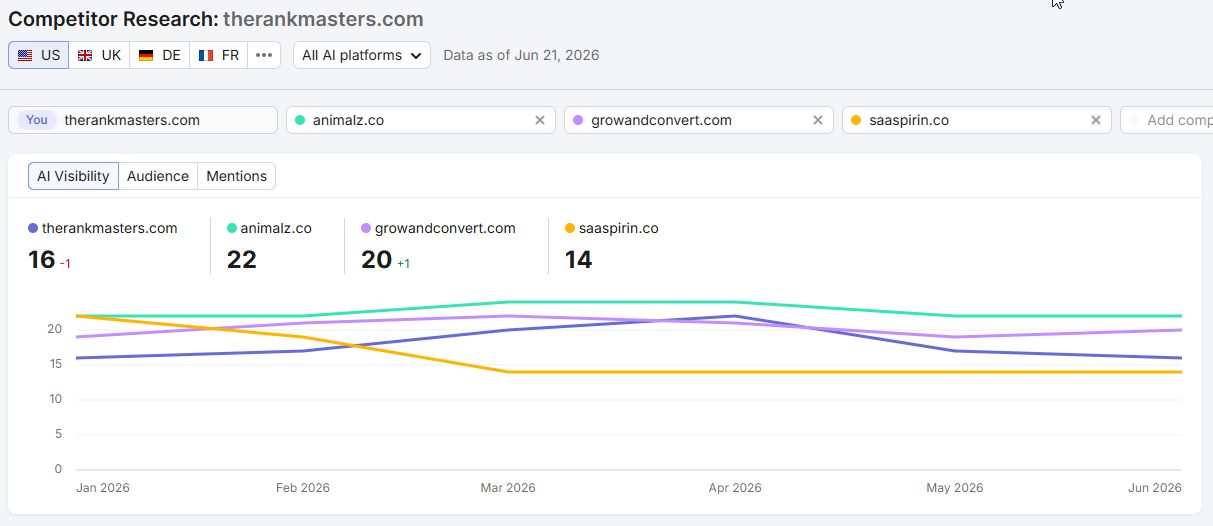
9. How Do You Benchmark AI Visibility Against Competitors?
Competitor benchmarking measures your share of voice, sentiment, and cited pages directly against named rivals, and it is what turns a private dashboard into a competitive map. A score in isolation tells you little; a score next to the two brands stealing your prompts tells you exactly where to work.
The fragmentation across engines makes this non-optional. Superlines' 2026 data recorded a single brand's citation volume differing by as much as 615 times between platforms, which means competitive position is engine-specific, not global. You can lead the category on one engine and trail badly on another, and only a side-by-side view will show it.
You run this in Competitor Research.
- Open AI > Competitor Research.
- Add the competitor domains that share your answer space.
- Compare share of voice, sentiment, and citation patterns across the set.
- Identify the prompts and topics where a competitor appears instead of you.
Reading the gap is where the strategy lives. The goal is not to chase every topic a competitor wins, it is to find the overlap between their strength and your revenue, namely the high-intent comparison prompts where losing the answer costs you a deal. Those are the gaps you close first, and the rest you note and move past.
Want to line your brand up against your two closest rivals? Open Semrush One on a 14-day trial and audit your pages against theirs prompt by prompt.
AI Search Visibility vs Traditional SEO Metrics
AI search visibility and traditional SEO metrics measure different surfaces, so you run them together rather than swapping one for the other. SEO tracks rankings, clicks, impressions, and backlinks on the classic SERP; AI visibility tracks mentions, citations, share of voice, sentiment, and answer presence inside generated responses.
| Dimension | Traditional SEO Metric | AI Visibility Metric |
|---|---|---|
| Where it lives | The ten blue links and SERP features. | The synthesized answer. |
| Core unit | Ranking position and CTR. | Mention and citation. |
| Competitive view | Share of organic traffic. | Share of voice in answers. |
| Quality signal | Backlinks and authority. | Recommendation rank and sentiment. |
| Outcome | Organic sessions. | AI referral sessions and conversion. |
The good news is that the foundations overlap heavily, so you are not starting over. Domain authority still does most of the work; SE Ranking's study of 2.3 million pages, as reported by Superlines, found domain traffic to be the strongest single predictor of AI citations. The same authority, structure, and freshness that earn rankings also earn citations.
Where they diverge is in what counts as a win. A page can rank first and still be skipped by the AI Overview, and a page outside the top ten can still get cited if it answers a sub-question cleanly. That is why a rank tracker alone now under-reports your real visibility, and why the two metric sets belong on one dashboard.
If you want help wiring both into a single reporting view, that is part of what our SaaS content marketing system is built to do.
10. How to Run an AI Visibility Audit and Set Up Tracking
First of all, if you want to run an AI Visibility Audit and set up tracking, automate it using a tool like SEMrush. Here’s how the audit report look like in SEMrush:
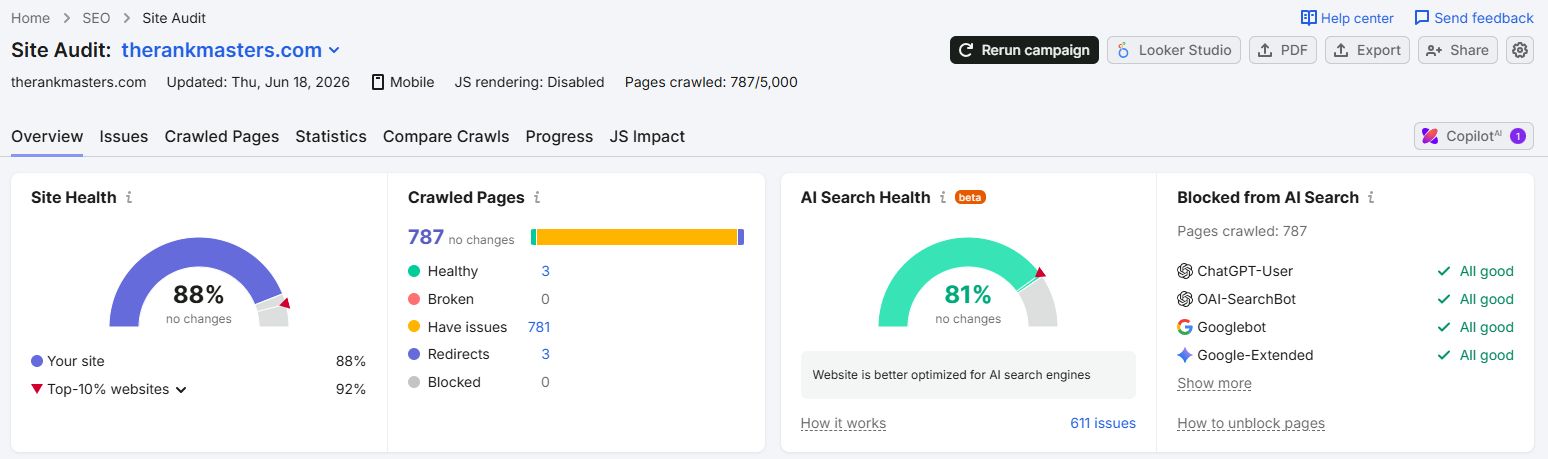
An AI visibility audit baselines your score, mentions, citations, sentiment, and competitor gaps, then maps each finding to the prompts and pages that can move it. Run it as a repeatable workflow, not a one-time snapshot, because AI answers shift faster than rankings do.
Here is the sequence that ties every metric in this guide into one pass.
- Baseline your AI Visibility Score and Mentions in Visibility Overview.
- Pull share of voice and sentiment from Brand Performance.
- List your cited pages and the money pages that are missing.
- Read your Distribution by LLM to find weak engines.
- Export the prompts you lose to competitors from the Questions report.
- Check AI Overview triggers and links in Position Tracking.
- Connect GA4 to My Reports for AI referral traffic and conversion.
- Re-run the whole pass weekly and trend every metric.
Freshness is the reason for that weekly cadence. AI visibility shifts daily, citations change constantly, and the freshest content tends to win the answer, so a quarterly check will always be reading stale data. A short weekly pass on the five or six metrics that matter beats an exhaustive audit you only run once.
| Audit Output | The KPI It Produces | Owner of the Fix |
|---|---|---|
| Score and mentions baseline | Trend line to govern. | Marketing lead. |
| Mention-to-citation gap | Page structure backlog. | Content and web. |
| Lost competitor prompts | Content roadmap. | Content strategy. |
| Weak-engine distribution | Channel-specific plan. | SEO and AEO. |
| AI referral conversion | Pipeline contribution. | Growth and RevOps. |
Executing this well is exactly the gap The Rank Masters closes for B2B SaaS teams, building an ICP-led content system that maps each topic cluster to a money page and to pipeline. The audit gives you the findings; the strategy decides which findings to act on first and how to turn them into content that wins the answer.
If you would rather not run this pass yourself, our AI visibility tracking and GEO services do it for you.
Which AI Visibility KPIs Map to Revenue and Pipeline?
The AI visibility KPIs that map to revenue are cited pages on money topics, recommendation rank on comparison prompts, and AI referral conversion, because each one sits directly on the path to a deal. Everything else is context that helps you move those three.
The trap is treating total mentions or a rising aggregate score as the goal. Those are vanity-adjacent unless they convert into cited money pages and qualified sessions. A brand can grow its mention count for low-intent informational prompts all year and add nothing to pipeline, which is why you weight the metrics rather than summing them.
| Revenue KPI | Why It Maps to Pipeline | What to Optimize |
|---|---|---|
| Cited pages on money topics | Citations on BOFU pages send buying-intent traffic. | Make comparison and pricing pages extractable. |
| Recommendation rank on comparison prompts | Being named first shapes the shortlist. | Win "best [category]" and "X vs Y" answers. |
| AI referral conversion | The session that becomes a demo or trial. | Match landing pages to AI-buyer intent. |
| Share of voice on category prompts | Owning the category answer compounds. | Defend, then expand the prompt set. |
For a small SaaS team with limited time, the honest advice is to ignore most of the dashboard and watch three numbers, namely share of voice on your category prompts, cited pages on your money topics, and AI referral conversion. Add sentiment as you scale, then prompt coverage, then the per-engine split. You can see how this plays out on a real account in our case studies, where the same prioritization drives the work.
The throughline across every metric in this guide is that visibility is only a means. The number that ends up mattering is whether the answer engines send you buyers who convert, and whether the pages they cite are the ones that make you money. Track for that, and the rest of the dashboard becomes diagnostic rather than decorative.
Frequently Asked Questions
Measure share of voice, prompts, and sentiment weekly, because AI answers change daily and a monthly check will read stale data. Review longer trends monthly against your content updates and competitor moves to separate signal from noise.
Entry-level AI visibility add-ons start around 99 dollars per month as of early 2026, with the Semrush AI Visibility Toolkit available as a standalone add-on at that price point. Packaging and pricing change often, so verify current terms before you commit.
Partly. GA4 now captures AI referral traffic, and manually querying ChatGPT, Perplexity, and Gemini with your target prompts costs nothing. Systematic share-of-voice, sentiment, and competitor tracking, however, needs a dedicated tool to stay consistent and trended over time.
A ghost citation is when an AI engine uses your content to build its answer without naming or linking you. It signals real influence you are not yet capturing as credit, and it usually means a page needs clearer attribution-worthy structure and entity signals.
No, AI visibility extends SEO rather than replacing it. The same domain authority, content structure, and freshness that earn rankings also earn AI citations, so the smart play is to run them as one connected system on a single dashboard.
Start with share of voice on your category prompts, cited pages on your money topics, and AI referral conversion. Those three connect reach, credit, and revenue, which is enough to make decisions. Add sentiment and prompt coverage once the basics are stable.
Turn Your Metrics Into a Strategy
You now have the metric set, the Semrush click-paths, and the benchmarks to read each number like an operator. The harder part is deciding which gaps to close first and how to turn a dashboard into content that wins the answer, which is the difference between data and a plan.
If thin BOFU coverage or missing AI citations are costing you pipeline, book a SaaS content strategy call and we will map your highest-intent topics to revenue.
Prefer to instrument it yourself first? Open the AI Visibility Toolkit free for 14 days and pull your baseline before we talk.