

You're getting traffic… but is it doing anything for your business?
If you're searching for "Best Website Traffic Analysis Tools", you probably don't need another list where every tool gets a gold star. You need someone who's actually used these platforms across real client accounts to tell you what works, what doesn't, and what the vendor pages won't mention.
That's what this guide is.
We evaluated 12 website traffic analysis tools based on three things that actually matter:
- What real users say — We cross-referenced G2, Capterra, and TrustRadius reviews to surface consistent praise and recurring complaints, not cherry-picked quotes.
- How well each tool solves problems — Can it tell you why traffic dropped, not just that it dropped? Can it connect visitors to revenue? We weighted tools that help you make decisions, not just stare at dashboards.
- How they fit together — No single tool does everything. We mapped which combinations (stacks) work best for SaaS, ecommerce, content sites, and agencies — so you stop paying for overlap.
At The Rank Masters, we configure these tools across dozens of B2B SaaS and growth-stage companies every quarter. This isn't a theoretical comparison — it's what we've seen actually work in production.
Last updated: [08/06/2026] — Pricing verified, tool counts refreshed, and a new section added on tracking AI search traffic (ChatGPT, Perplexity, Gemini referrals) which most older guides miss entirely.
🤙 If you'd rather have an expert configure it all and tell you what to do next, you can always Contact The Rank Masters to speak with our SEO strategists at a specialist B2B SaaS SEO Agency.
What Is a Website Traffic Analysis Tool? (30-Second Explanation)
A website traffic analysis tool is any software that helps you:
See who is coming to your website, how they got there, what they do, and whether they end up converting.
Most tools track:
- Traffic sources – organic, paid, social, email, referral
- Behavior – pages viewed, session duration, bounce rate, events
- Conversions – form fills, purchases, signups, downloads
- User journeys – which path users take before converting (or leaving)
Some tools focus on your own data (analytics), others estimate competitors’ traffic (competitive intelligence tools).
Quick Comparison Table – Best Website Traffic Analysis Tools in 2026
Here’s a high-level view. (You’ll go into detail below.)
| Tool | Best For | Key Focus | Pricing Snapshot* |
|---|---|---|---|
| Google Analytics 4 (GA4) | General web analytics, all sites | Traffic, behavior, conversions | Free |
| Google Search Console | SEO + organic search | Search queries, indexing, CTR | Free |
| Matomo | Privacy-focused GA alternative | Analytics + on-prem/cookieless | Free (self-hosted) / Paid cloud |
| Plausible / Fathom | Simple, privacy-friendly | Lightweight traffic analytics | Paid (low monthly) |
| Hotjar / Microsoft Clarity | UX & behavior analysis | Heatmaps, recordings, feedback | Free + paid tiers (Hotjar); Clarity free |
| Mixpanel / Amplitude | SaaS & product analytics | Funnels, cohorts, retention | Free tier + paid plans |
| Ahrefs / Semrush / Similarweb | Competitor & market traffic | Traffic estimates, keywords, channels | Paid (SEO suites) |
| SE Ranking | All-in-one SEO + traffic checking | Rank tracking, traffic estimates, site audit | From $65/month |
| Cloudflare Web Analytics | Privacy-first, lightweight | Cookieless, no-JS traffic analytics | Free |
| Bing Webmaster Tools | Non-Google search data | Bing queries, IndexNow, AI traffic signals | Free |
| Looker Studio | Dashboard consolidation | Combine GA4 + GSC + other sources visually | Free |
| Ubersuggest | Budget-friendly SEO & traffic | Keywords, traffic estimates, domain overview |
1. Google Analytics 4 (GA4)
What it does?
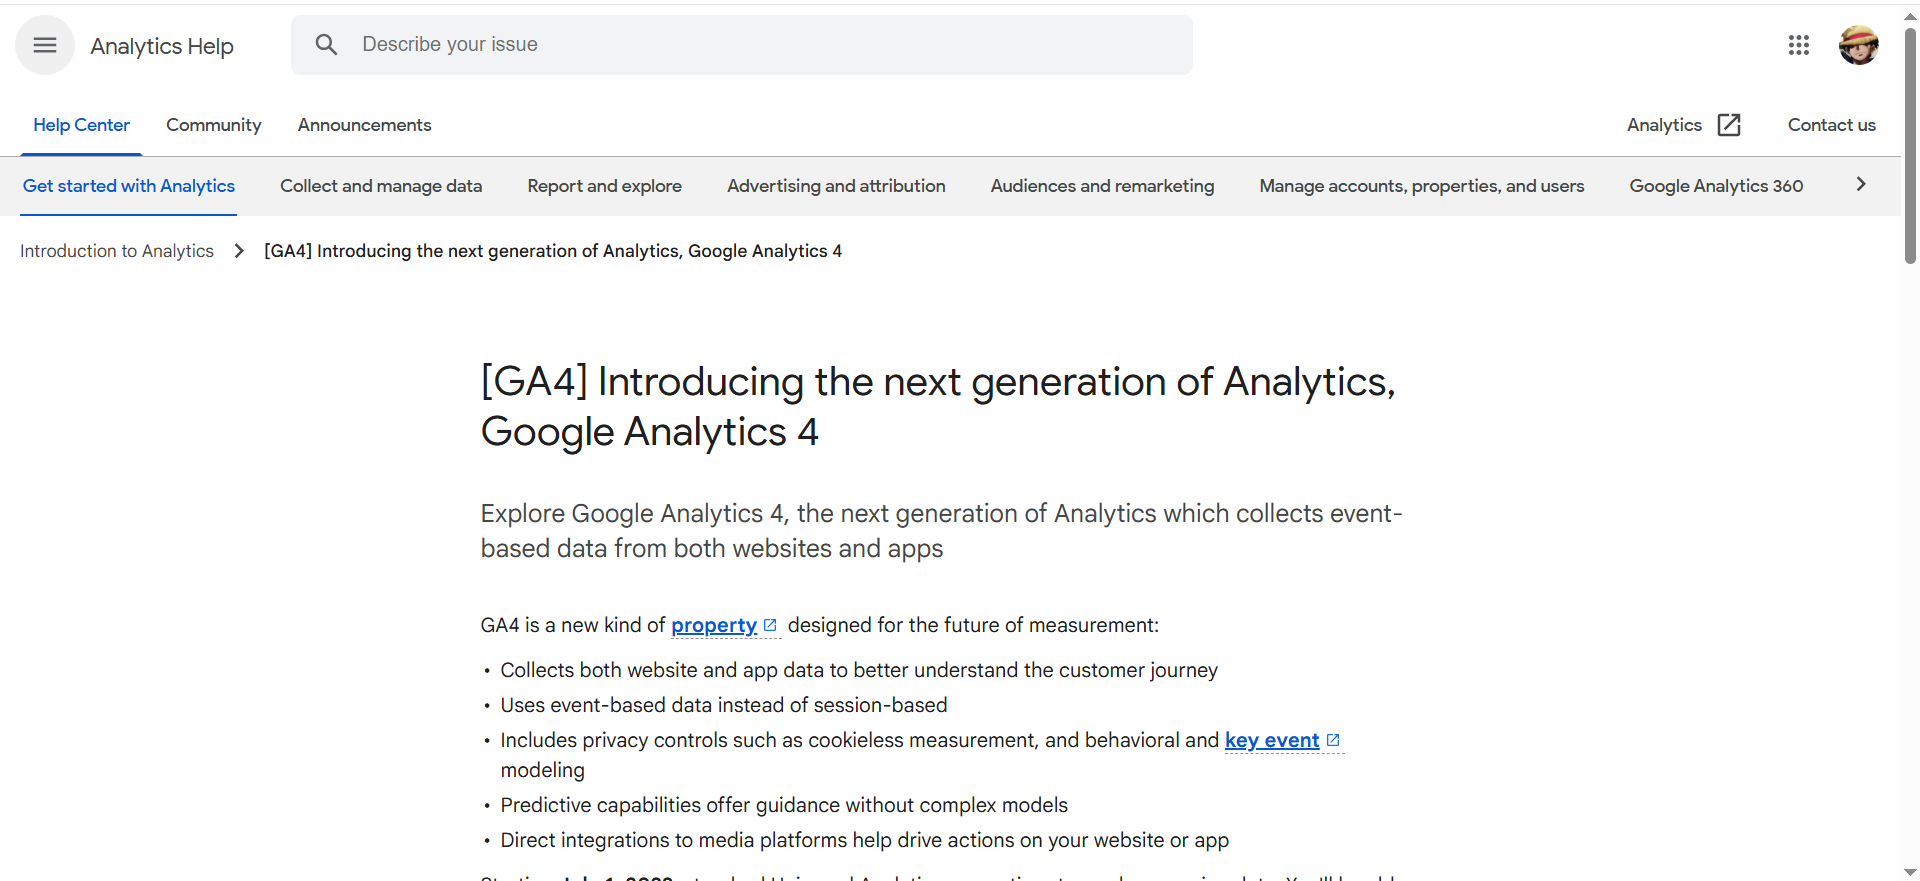
Google Analytics 4 (GA4) tracks how users arrive on your site or app, what they do, and whether they convert. It uses an event-based model instead of pageview-only tracking, so you can capture granular actions like scrolls, clicks, video plays, or purchases. GA4 combines web and app data, supports funnels and attribution, and integrates tightly with Google Ads. It’s the default analytics standard for most websites today.
Why teams use it?
Teams use GA4 because it’s powerful, flexible, and free at standard scale. Marketers rely on it to measure campaigns, ROAS, and acquisition channels. Founders and product teams use it to understand which pages and flows actually drive signups and revenue. Agencies like it because almost every client already has GA, so it becomes a shared source of truth.
Who is this tool for (ICP)?
GA4 works for almost any digital business that cares about traffic and conversions:
- SMBs and local businesses that need a serious but free analytics platform.
- Content and media sites tracking engagement and content performance.
- Ecommerce brands monitoring funnels, product performance, and revenue.
- SaaS and startups looking for acquisition analytics across web + app.
- Agencies managing many client sites and reporting on performance.
How this tool fits in this AI-first era?
GA4 provides the clean, structured event data that AI tools and copilots need to answer “what’s happening in our funnel?” in plain language. Exporting GA4 data to BigQuery makes it easy to plug into AI/ML models for prediction and automated reporting.
- Feed GA4 events into AI dashboards to auto-summarize performance.
- Use predictive audiences and conversions to improve smart bidding.
- Track and compare AI-search traffic (ChatGPT/Gemini) vs classic SEO.
How does Google Analytics 4 work?
You install a GA4 tag (or use Google Tag Manager) on your site/app. The tag sends events to Google’s servers, which GA4 groups into users, sessions, and reports. You configure conversions, audiences, and custom events inside the interface, and can also export raw data to BigQuery for deeper analysis.
Free tier?
Yes – GA4 Standard is free; GA360 (enterprise) is paid and starts around $50k/year.
Strengths? GA4’s main strengths are reach and ecosystem:
- Free and powerful enough for most businesses.
- Deep integration with Google Ads, Search Console, and Looker Studio.
- Flexible event model usable for content, ecommerce, and apps.
- Massive learning resources and community support.
Weaknesses?
- Steep learning curve and often confusing UI.
- Relies on browser tracking, so it’s affected by ad blockers and consent.
- Limited product/retention analytics compared to Mixpanel/Amplitude.
Key Capabilities?
- Cross-device event tracking and reporting.
- Conversions, funnels, and attribution models.
- Audience building and activation in Google Ads.
- BigQuery export for raw event data.
Pricing snapshot?
- GA4 Standard: Free.
- GA360: From roughly $50,000/year and up based on volume.
Best for?
Best as the core analytics hub for most websites. If you only pick one analytics tool, GA4 is usually it, and then you layer behavior or product tools on top. It’s ideal when you’re okay with some complexity in exchange for deep data and integrations.
Rating
2. Google Search Console (GSC)
What it does?
Google Search Console tells you how your site performs in Google’s organic search results. It shows queries, clicks, impressions, CTR, and average positions, plus technical issues like indexing errors and Core Web Vitals. You can submit sitemaps, request indexing, and see which URLs are actually appearing in search. It’s your direct window into how Google sees your site.
Why teams use it?
Teams use GSC because it’s the only place to get first-party query and SERP data from Google. SEO and content teams rely on it to find underperforming pages, new keyword opportunities, and technical issues blocking rankings. It’s also essential for tracking the impact of SEO changes across countries, devices, and search features. And it’s completely free.
Who is this tool for (ICP)?
- SEO specialists and content marketers.
- Bloggers and small businesses focused on organic traffic.
- Technical SEOs and devs monitoring indexing and CWV.
- Agencies delivering SEO retainers and reports.
How this tool fits in this AI-first era?
As SERPs gain AI overviews and answer boxes, GSC remains your core signal for which queries still show your pages and how often they get clicked. You can feed GSC exports into AI tools to surface content gaps, decays, and quick-win opportunities automatically.
- Use AI to summarize “biggest winners/losers” in GSC data.
- Identify topics likely to win featured snippets or AI overviews.
- Monitor how AI changes impact impressions and CTR for key queries.
How does Google Search Console work?
You verify site ownership (DNS, HTML file, tag, GA, etc.), and Google starts showing search data as it crawls and indexes your URLs. GSC aggregates performance by query, page, country, and device, and surfaces indexing or UX problems. You can export CSVs or use the API to connect GSC to dashboards or AI assistants.
Free tier?
Yes – 100% free.
Strengths?
- Direct search data from Google itself.
- Critical for keyword, CTR, and technical SEO analysis.
- No cost, generous data retention and API.
Weaknesses?
- Only covers Google organic, not other channels.
- Data is delayed (not real-time).
- Limited visualization; often used alongside GA/BI tools.
Key Capabilities?
- Search performance (queries & pages).
- Index coverage and sitemap diagnostics.
- Core Web Vitals and Page Experience.
- URL inspection and manual reindex requests.
Pricing snapshot?
- Google Search Console: Free.
Best for?
Best for any site doing SEO, from solo bloggers to enterprises. For your blog, this is tool #2 you always mention after GA4 when talking about organic traffic analysis.
Rating
3. Matomo
What it does?
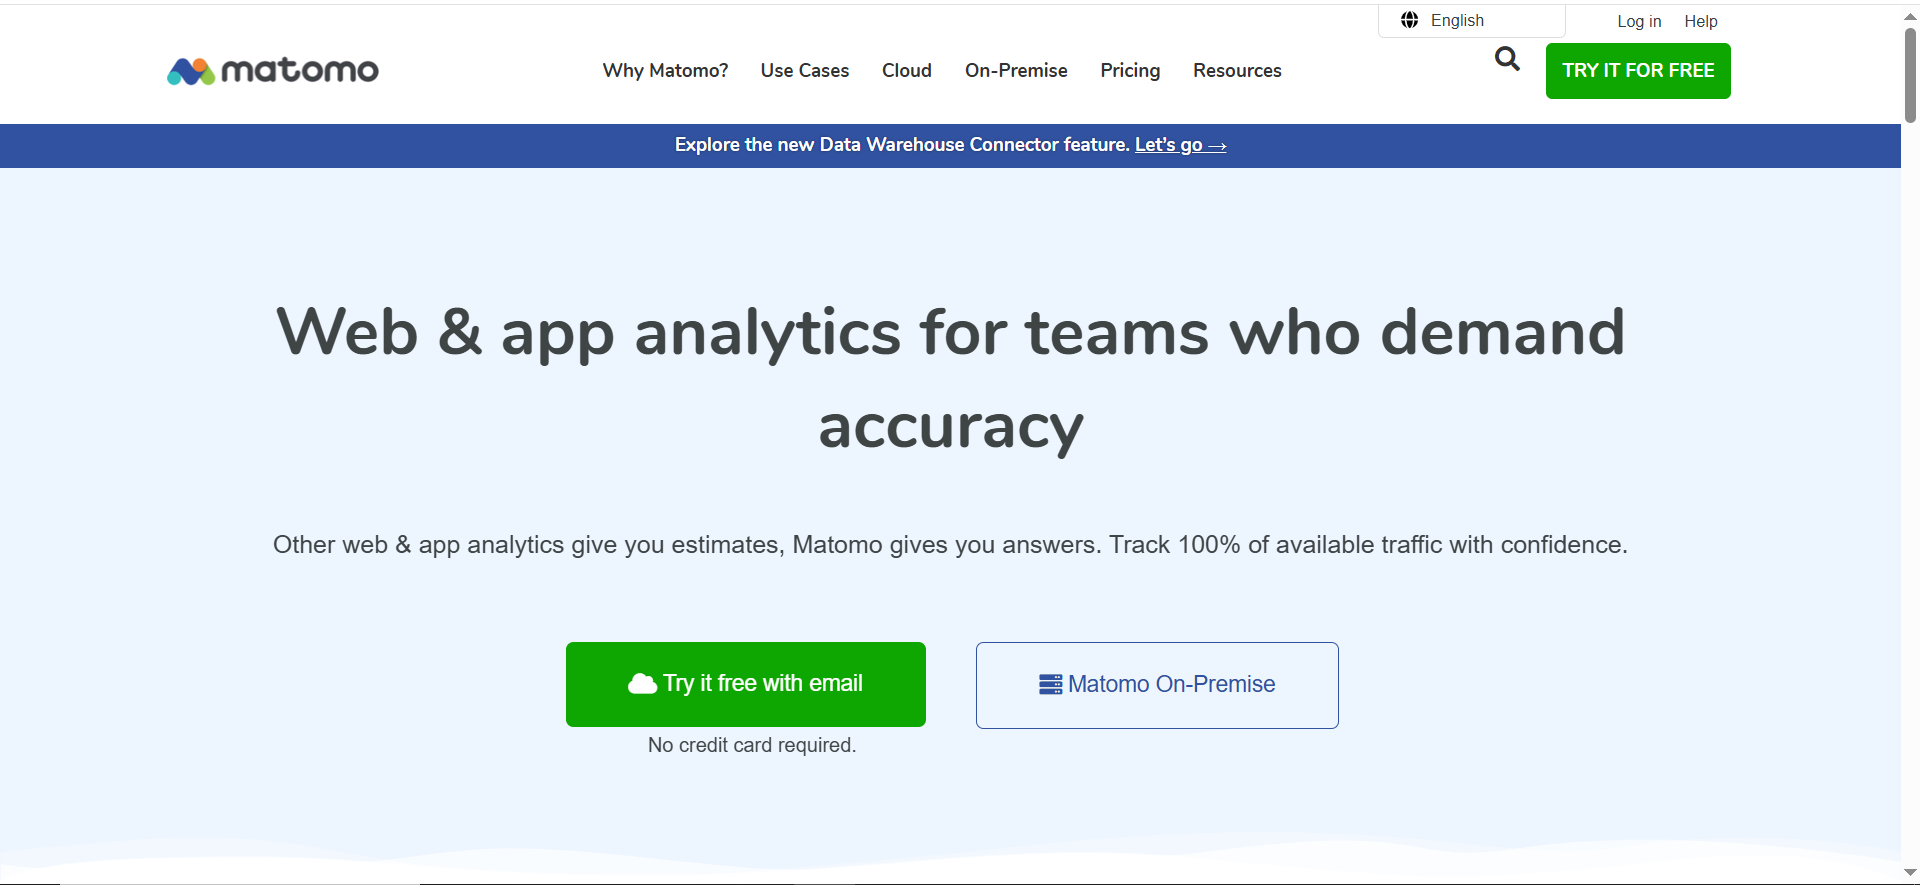
Matomo is a web analytics platform that you can host yourself or run via Matomo Cloud. It offers standard analytics (sessions, events, goals, ecommerce), plus optional heatmaps, recordings, and more. The big differentiator is data ownership—you keep full control of all tracking data, which makes it attractive for privacy-sensitive teams.
Why teams use it?
Teams pick Matomo when they want “GA-style power, but privacy-first and not owned by Google.” EU and regulated industries often prefer Matomo to reduce legal risk around US data transfers. It’s also open-source, so technical teams can extend it or integrate at database level. Agencies use it when clients insist on self-hosted analytics.
Who is this tool for (ICP)?
- EU-based or heavily regulated organizations.
- Public sector, finance, healthcare, education.
- Privacy-first brands looking to avoid Google Analytics.
- Technical teams that like open-source and self-hosting.
How this tool fits in this AI-first era?
Matomo provides first-party analytics data you can safely feed into internal AI models without sending it to big ad platforms. Its self-hosted option is ideal if your legal team is strict about where training data lives.
- Use Matomo logs as training data for internal AI reporting copilots.
- Combine with CRM/product data for in-house churn and LTV models.
- Keep analytics running with cookieless/privacy-friendly setups.
How does Matomo work?
You install a tracking script or enable log analytics, and Matomo stores all hits in your own DB (on-prem) or their cloud. You define sites, goals, campaigns, and ecommerce tracking, and optional plugins add UX features like heatmaps and A/B tests. Reports are similar to GA, but you can also query the underlying data directly if self-hosted.
Free tier?
- On-Premise: Software is free; you pay for hosting.
- Cloud: Paid only, with free trial.
Strengths?
- Full data ownership and strong privacy story.
- No sampling; you can track 100% of traffic.
- Open-source and extensible with many plugins.
Weaknesses?
- Self-hosting adds setup and maintenance overhead.
- UI/UX feels less slick than many newer SaaS tools.
- Fewer out-of-the-box templates and community dashboards than GA.
Key Capabilities?
- Full web analytics (events, goals, funnels, ecommerce).
- Optional heatmaps, session recordings, A/B testing.
- Advanced privacy and GDPR controls.
- Tag Manager and many integrations.
Pricing snapshot?
- Matomo On-Premise: Free core; paid premium plugins and support.
- Business - 22EUR Per month
- Matomo Cloud: Tiered pricing by traffic (entry plans around small-site budgets).
Best for?
Best for organizations where legal and compliance would otherwise block analytics. Perfect when you want strong tracking but your brand promise (or regulations) doesn’t sit well with Google Analytics.
Rating
4. Plausible / Fathom (Simple, Privacy-First Analytics)
What it does?
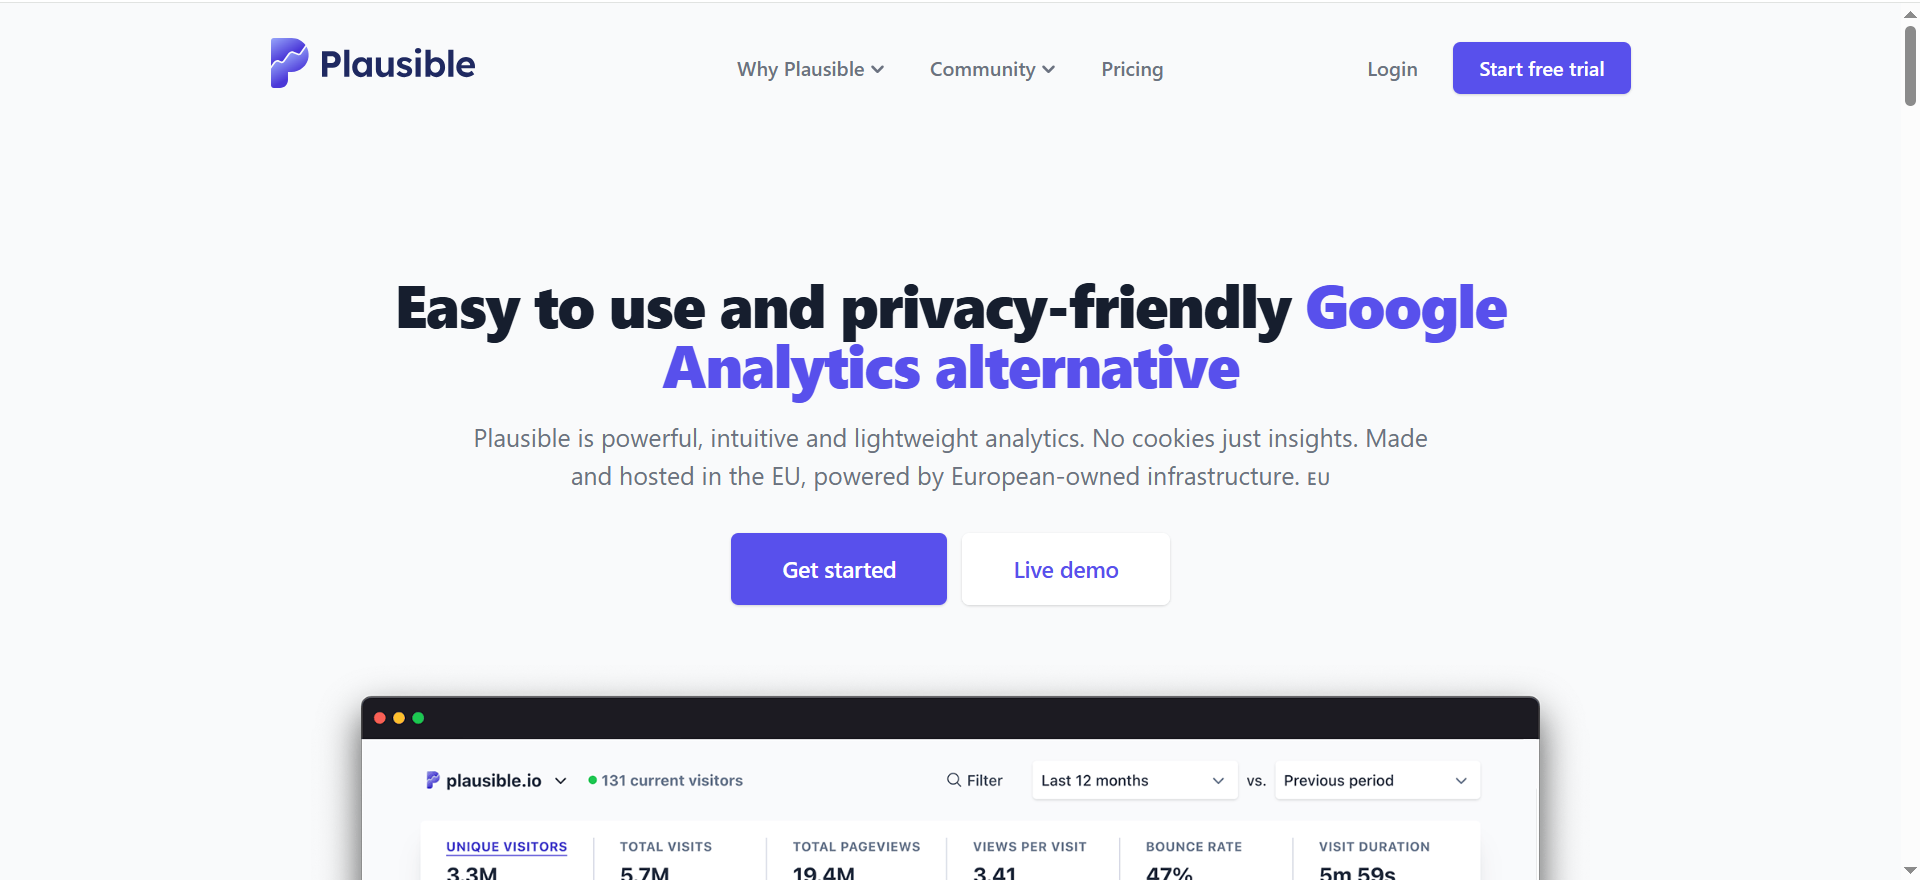
Plausible and Fathom are lightweight, privacy-friendly analytics tools focused on simple dashboards and non-cookie tracking. They show you visits, pages, sources, and simple goals, without complex reports. Scripts are tiny, so they barely affect performance.
Why teams use it?
Teams use these when GA4 feels like overkill and they just want clean, easy-to-understand stats. Privacy-conscious brands also like that they can avoid cookie banners in many jurisdictions. Non-technical founders and marketers appreciate that they can understand the dashboard at a glance.
Who is this tool for (ICP)?
- Bloggers, indie creators, small SaaS and startups.
- SMBs and NGOs that care about privacy and simplicity.
- Teams with stakeholders who dislike complex dashboards.
- Performance-sensitive sites where script weight matters.
How this tool fits in this AI-first era?
Because the data is small and clean, AI tools can easily summarize performance without dealing with dozens of dimensions. Privacy-by-design, cookieless tracking keeps your analytics resilient as browsers tighten rules.
- Feed simple stats into AI to auto-write traffic/email summaries.
- Track AI-search vs SEO vs social campaigns via UTMs and goals.
- Use public dashboards as inputs for market research bots.
How does it work?
You drop a small JS snippet on your site. It sends anonymized, aggregated events to their servers, which appear in a simple dashboard by page, referrer, country, device, and goals. No sampling, no personal data, and very limited configuration.
Free tier?
No permanent free plan, but both offer free trials.
Strengths?
- Very simple, clean, and fast dashboards.
- Privacy-first, cookieless, and EU-friendly (Plausible).
- Tiny script size and minimal performance impact.
Weaknesses?
- Not designed for deep funnels or product analytics.
- Fewer integrations and advanced reports than GA.
- Paid only after trial, unlike GA’s free tier.
Key Capabilities?
- High-level traffic and referrer analytics.
- Simple goals and conversions.
- UTM / campaign breakdowns.
- Public dashboards and multi-site reporting.
Pricing snapshot?
- Plausible: Starts around £6–9/month for low-traffic sites; scales by pageviews.
- Fathom: 3 editions, roughly $15/month, with free trial.
Best for?
Best for teams who want just enough analytics in a privacy-friendly package. Great as a simple exec dashboard even if GA4 is still the underlying “big” analytics tool.
Rating
5. Hotjar / Microsoft Clarity (Behavior & UX)
What it does?
Hotjar and Microsoft Clarity show how users interact with your pages via heatmaps and session recordings. You can see where they click, how far they scroll, and where they struggle. Hotjar adds surveys and feedback widgets, while Clarity focuses on core behavior analytics and is free.
Why teams use it?
Teams use these tools when analytics numbers don’t explain why conversions are low. CRO and UX teams review recordings and heatmaps to spot friction, broken UX, and missed expectations. Clarity’s unlimited free plan makes behavior analytics accessible to anyone, and Hotjar’s extra UX features help with deeper research.
Who is this tool for (ICP)?
- CRO and growth specialists.
- UX/product designers and PMs.
- Ecommerce and SaaS teams focused on funnels.
- Agencies doing UX/CRO audits.
How this tool fits in this AI-first era?
Behavior tools provide the qualitative data AI dashboards can’t infer from numbers alone—recordings and heatmaps show actual struggles. Clarity in particular is adding AI-driven insights to auto-surface interesting sessions and patterns.
- Use AI to prioritize which recordings to watch first.
- Let AI summarize common UX issues from feedback and behavior data.
- Compare behavior of AI-search visitors vs other channels.
How does it work?
You add a script to your site that records interaction data and, optionally, full sessions. Heatmaps aggregate many user interactions per page, while session replays show a single user’s journey. You can filter by device, referrer, behavior (rage clicks, dead clicks), and more.
Free tier?
- Clarity: Completely free.
- Hotjar: Free Basic tier, then paid plans.
Strengths?
- Visual, intuitive view of user behavior.
- Essential companion to GA for diagnosing conversion issues.
- Clarity offers unlimited data for free; Hotjar offers rich UX tools.
Weaknesses?
- Not a full analytics replacement—works best alongside GA.
- Large volumes of recordings can be overwhelming.
- Hotjar pricing can rise with volume for busy sites.
Key Capabilities?
- Click/scroll/move heatmaps.
- Session recordings and frustration signals (rage clicks, etc.).
- Surveys, feedback, and NPS (Hotjar).
- Integrations with GA and other tools.
Pricing snapshot?
- Microsoft Clarity: Free.
- Hotjar:
- Basic: Free.
- Plus: ~$39/month billed monthly.
- Higher tiers (Business/Scale) scale by session volume.
Best for?
Best when you’re actively optimizing landing pages, product pages, and onboarding. Perfect for pairing with GA4 in your blog: GA4 explains “what,” Hotjar/Clarity show “how.”
Rating
6. Mixpanel / Amplitude (Product Analytics)
What it does?
Mixpanel and Amplitude track in-product events to show how users use your app over time. They focus on funnels, retention, cohorts, and feature usage rather than just pageviews. This makes them ideal for SaaS and app teams that care about activation, engagement, and long-term retention.
Why teams use it?
Teams use these tools when GA4 no longer answers deeper product questions like “Which features correlate with higher retention?” or “What journeys do power users follow?”. Product managers and data teams like their powerful segmentation and cohort tools. Growth teams use them to test and monitor onboarding changes and feature launches.
Who is this tool for (ICP)?
- SaaS and product-led growth companies.
- PMs and UX teams responsible for feature success.
- Growth/data teams that care about retention and expansion.
- Scale-ups and enterprises with high-traffic apps.
How this tool fits in this AI-first era?
Event-rich product datasets are perfect for training AI models that predict churn, upsell potential, or activation success. These platforms themselves increasingly offer AI-driven insights and natural-language querying.
- Feed event data into ML models for churn/LTV scoring.
- Use AI layers to ask “plain English” questions about product usage.
- Compare AI-search-origin users vs other cohorts on long-term behavior.
How does it work?
You instrument events in your app (via SDK or event pipeline) with user IDs and properties. Mixpanel/Amplitude store that data and let you build funnels, cohorts, and retention charts via their UI. They integrate with warehouses, CDPs, and messaging tools to power lifecycle campaigns and experiments.
Free tier?
- Mixpanel: Free up to ~1M monthly events, then paid.
- Amplitude: Starter free tier; Plus and higher are paid.
Strengths?
- Deep product analytics and retention insights.
- Strong self-serve reporting for PMs and marketers.
- Good integrations with data stacks and engagement tools.
Weaknesses?
- Overkill for simple marketing sites.
- Requires thoughtful event schema design.
- Paid plans can get pricey at very high volumes.
Key Capabilities?
- Event-level tracking across web and mobile.
- Funnels, retention, and cohort analysis.
- Powerful segmentation and breakdowns.
- Integrations with warehouses, CDPs, and marketing tools.
Pricing snapshot?
- Mixpanel:
- Free: up to 1M monthly events.
- Paid: usage-based (e.g., ~$0.28 per 1k extra events); Growth/Enterprise custom.
- Amplitude:
- Starter: Free.
- Plus: from around $49/month.
- Growth/Enterprise: custom pricing.
Best for?
Best for SaaS and PLG companies who want to deeply understand product usage and retention, not just traffic. In your blog, you can position these as “graduation tools” once GA4 + behavior analytics are in place.
Rating
7. Ahrefs / Semrush / Similarweb (Competitive & Market Intelligence)
What it does?
Ahrefs, Semrush, and Similarweb estimate traffic, keywords, backlinks, and channel mix for you and your competitors. They’re used for keyword research, content planning, backlink analysis, and market share estimation—not for on-site analytics. They help you see where competitors get traffic and what topics/content are winning in your space.
Why teams use it?
Teams use these tools for strategy, not daily reporting. SEO teams use them to build topic clusters and discover ranking opportunities. Growth and leadership teams use them to understand market dynamics, competitors’ strengths, and traffic potential. Agencies lean heavily on them for audits, pitches, and ongoing SEO/content retainers.
Who is this tool for (ICP)?
- SEO and content teams.
- Agencies and consultants selling SEO/content services.
- CMOs and growth leads needing market-level insight.
- Bizdev and strategy teams doing research.
How this tool fits in this AI-first era?
These platforms are rapidly adding features to track AI visibility and how brands show up in AI search/LLM answers, not just classic SERPs. Their exports are perfect for LLMs to digest and turn into competitive strategy briefs.
- Track which competitors dominate in AI-shaped SERPs.
- Use AI to summarize huge keyword/backlink datasets into prioritized plans.
- Combine with GA/GSC data to choose high-impact content bets.
How does it work?
They crawl the web and SERPs, ingest clickstream/panel data, and run models to estimate keyword rankings and traffic per site. You plug in a domain or keyword and get reports on rankings, estimated traffic, backlinks, and top pages. Similarweb goes further into channel breakdowns and market share.
Free tier?
- Ahrefs: Limited free tools + free Ahrefs Webmaster Tools; full product paid.
- Semrush: Limited free account and trials; core use is paid.
- Similarweb: Limited free access; full platform is paid.
Strengths?
- Essential for competitor and keyword intelligence.
- Huge databases for keywords and backlinks (especially Ahrefs/Semrush).
- Strong reports for market share and traffic composition (Similarweb).
Weaknesses?
- Data is estimated, not as precise as GA/GSC.
- Can be expensive for small businesses.
- Learning curve across many tools/menus.
Key Capabilities?
- Keyword research and topic discovery.
- Backlink and authority analysis (Ahrefs in particular).
- Competitive traffic and market share estimates (Similarweb).
- Site audits and rank tracking (Semrush).
Pricing snapshot?
- Ahrefs: Tiered plans from $0 (limited) up to around $499/month for top enterprise tiers.
- Semrush:
- Pro/Starter: around $165/month.
- Guru: around $248/month.
- Business: from $455/month+.
- Similarweb:
- Pro: starting around $8,000/year for core marketing analytics.
Best for?
Best for strategy and planning, rather than day-to-day site analytics. In your blog, you can position them as the tools you use at The Rank Masters to design content and SEO strategy on top of what GA4/GSC reveal.
Rating
8. SE Ranking
What it does?
SE Ranking is an all-in-one SEO platform that includes a website traffic checker, rank tracker, site audit tool, backlink monitor, and keyword research suite. Its traffic checker estimates any domain's organic and paid visitors, top pages, and keyword rankings, making it a strong mid-market alternative to Ahrefs and Semrush at a lower price point.
Why teams use it?
Teams use SE Ranking when they want Semrush-level functionality without the Semrush-level price tag. Agencies in particular appreciate its white-label reporting, client seat management, and the ability to combine rank tracking with traffic analysis in one dashboard. In-house SEOs use it for daily rank monitoring and quick competitive checks.
Who is this tool for (ICP)?
- Small to mid-sized agencies managing 10–50 client sites.
- In-house SEO teams at growth-stage companies on tighter budgets.
- Freelance SEO consultants who need an affordable all-in-one.
- Marketing managers who want one tool instead of three subscriptions.
How this tool fits in this AI-first era?
SE Ranking has added AI-generated content briefs and is expanding its keyword clustering with AI-driven topic grouping. Its traffic checker helps you benchmark competitors' organic performance alongside AI-search visibility, though dedicated AI visibility tools go deeper.
Free tier?
Limited free access to the website traffic checker. Full platform requires a paid plan with a 14-day free trial.
Strengths?
- Competitive pricing for a full-featured SEO suite.
- Accurate rank tracking with daily updates.
- Clean UI and faster learning curve than Semrush.
Weaknesses?
- Smaller keyword and backlink database than Ahrefs or Semrush.
- Traffic estimates less reliable for low-traffic sites.
- Advanced features like API access only on higher plans.
Key Capabilities?
- Website traffic estimation for any domain.
- Daily rank tracking across Google, Bing, Yahoo.
- Site audit with on-page SEO recommendations.
- Backlink monitoring and competitor backlink analysis.
Pricing snapshot?
- Essential: From ~$65/month.
- Pro: From ~$119/month.
- Business: From ~$259/month.
Best for?
Best for agencies and in-house teams who want the analytical depth of a big SEO suite at roughly half the cost. Position it as the "value pick" in your stack if Ahrefs or Semrush pricing is a barrier.
Rating
9. Cloudflare Web Analytics
What it does?
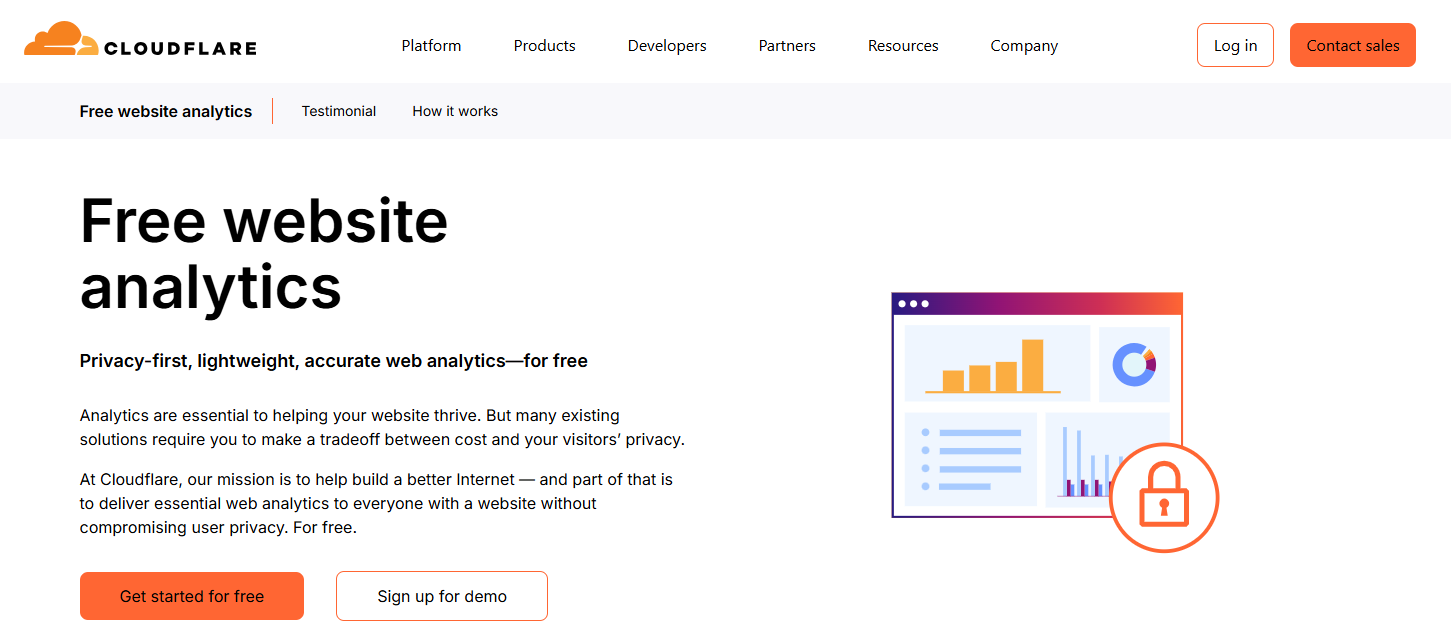
Cloudflare Web Analytics is a free, privacy-first analytics tool that measures traffic without using client-side cookies or tracking individuals. It captures Core Web Vitals, page views, visits, top pages, referrers, and countries. Unlike GA4, it works even when JavaScript is blocked by ad blockers, so it often captures 10–15% more traffic than traditional analytics.
Why teams use it?
Teams add Cloudflare Web Analytics as a second source of truth alongside GA4. Because it's server-side and cookieless, it picks up visits that GA4 misses due to ad blockers and consent rejection. It's also completely free with no data limits, making it a zero-cost way to validate GA4 numbers.
Who is this tool for (ICP)?
- Any website already using Cloudflare CDN (zero setup effort).
- Privacy-conscious businesses that want analytics without cookie banners.
- Developers and technical teams who prefer minimal, fast dashboards.
- Teams who want a backup source to cross-check GA4 data.
How this tool fits in this AI-first era?
Cloudflare's edge network sees all traffic before it hits your server, which means it captures bot traffic and AI crawler visits that client-side tools miss. This gives teams a more complete picture of who (and what) is actually hitting their site.
Free tier?
Yes — completely free with no traffic limits, no sampling, and no paid tiers.
Strengths?
- 100% free, unlimited data.
- Cookieless, ad-blocker-resistant tracking.
- Core Web Vitals built in.
Weaknesses?
- Very basic dashboard — no funnels, events, or conversions.
- No segmentation or audience demographics.
- Best as a complement, not a replacement for GA4.
Key Capabilities?
- Page views, visits, unique visitors.
- Top pages, referrers, countries, browsers, OS.
- Core Web Vitals (LCP, FID, CLS) per page.
- Works without JavaScript tag if using Cloudflare proxy.
Pricing snapshot?
- Cloudflare Web Analytics: Free.
Best for?
Best as a lightweight backup to GA4 that captures traffic ad blockers hide. If you're already on Cloudflare, activating it takes one click. Use it to spot discrepancies between GA4-reported numbers and actual visit volumes.
Rating
- 4.5/5 on G2 (Cloudflare platform overall)
10. Bing Webmaster Tools

What it does?
Bing Webmaster Tools is Microsoft's equivalent of Google Search Console. It shows how your site performs in Bing search, including queries, clicks, impressions, crawl data, and indexing status. In 2026, it's become increasingly important because Bing powers search for ChatGPT, Copilot, and DuckDuckGo, meaning Bing Webmaster Tools is now your primary window into AI-driven search traffic.
Why teams use it?
Teams that previously ignored Bing are now paying attention because AI search engines route queries through Bing's index. If ChatGPT is citing your content (or not), Bing Webmaster Tools is where you see the signals. It also supports IndexNow for instant page indexing, which is faster than Google's typical crawl schedule.
Who is this tool for (ICP)?
- Any site targeting US audiences (Bing holds ~10% US search share).
- Teams tracking AI search visibility (ChatGPT, Copilot, Perplexity).
- Technical SEOs who want faster indexing via IndexNow.
- Sites already in Google Search Console who want cross-engine data.
How this tool fits in this AI-first era?
This is the tool's biggest unlock in 2026. Since Bing's index feeds ChatGPT and Microsoft Copilot, Bing Webmaster Tools is now the closest thing to an "AI search console." It shows backlink data, crawl errors, and search queries from an index that powers multiple AI products.
Free tier?
Yes — completely free.
Strengths?
- Direct insight into Bing + AI search engine visibility.
- IndexNow support for instant crawling.
- Import Google Search Console data for easy setup.
Weaknesses?
- Smaller search volume than Google for most markets.
- Fewer community resources and documentation.
- Dashboard UI less polished than GSC.
Key Capabilities?
- Search performance: queries, clicks, impressions, CTR for Bing.
- Site scan and SEO audit.
- IndexNow for rapid URL submission.
- Backlink reports.
Pricing snapshot?
- Bing Webmaster Tools: Free.
Best for?
Best for any team that cares about AI search visibility in 2026. Even if Bing organic isn't your priority, the fact that Bing's index powers ChatGPT's web browsing makes this a must-have for understanding how AI products discover and cite your content.
Rating
11. Looker Studio (formerly Google Data Studio)
What it does?
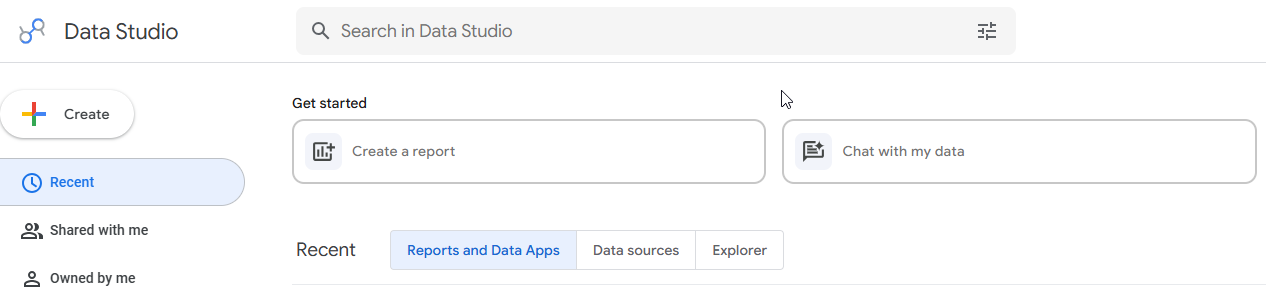
Looker Studio is Google's free dashboard and reporting tool. It connects to GA4, Search Console, Google Ads, BigQuery, Google Sheets, and dozens of third-party sources to create interactive, shareable reports. It doesn't collect data itself — it visualizes data from your other tools in one place.
Why teams use it?
Teams use Looker Studio when they're drowning in tabs. Instead of switching between GA4, GSC, and spreadsheets, you build one dashboard that pulls live data from all of them. Agencies rely on it heavily for client reporting — branded, automated, and easy to share as a link. It's also the glue between GA4's raw data and human-readable insights.
Who is this tool for (ICP)?
- Agencies delivering monthly SEO and marketing reports.
- Marketing teams that need cross-tool dashboards for leadership.
- Data-savvy marketers who want custom visualizations without writing code.
- Any team using GA4 + GSC who wants unified reporting.
How this tool fits in this AI-first era?
Looker Studio connects to BigQuery, where you can export GA4 event data and combine it with AI-generated datasets. This makes it the visualization layer for AI-augmented analytics workflows — you can pipe AI model outputs into Sheets or BigQuery and have them auto-populate your Looker dashboards.
Free tier?
Yes — completely free. Looker Studio Pro (enterprise features) is paid.
Strengths?
- Free, unlimited reports and data sources.
- Native GA4 and GSC connectors.
- Shareable, auto-refreshing dashboards.
Weaknesses?
- Can be slow to load with large datasets.
- Learning curve for building custom calculated fields.
- Limited built-in alerting (you need separate tools for anomaly detection).
Key Capabilities?
- Connect 800+ data sources (native + partner connectors).
- Interactive filters, date ranges, and drill-downs.
- Scheduled email delivery of reports.
- Template gallery for quick starts.
Pricing snapshot?
- Looker Studio: Free.
- Looker Studio Pro: Custom pricing (enterprise).
Best for?
Best as the reporting layer on top of your analytics stack. Don't use it instead of GA4 — use it to make GA4 and GSC data presentable and actionable. Especially valuable for agencies managing multiple client dashboards.
Rating
12. Ubersuggest
What it does?
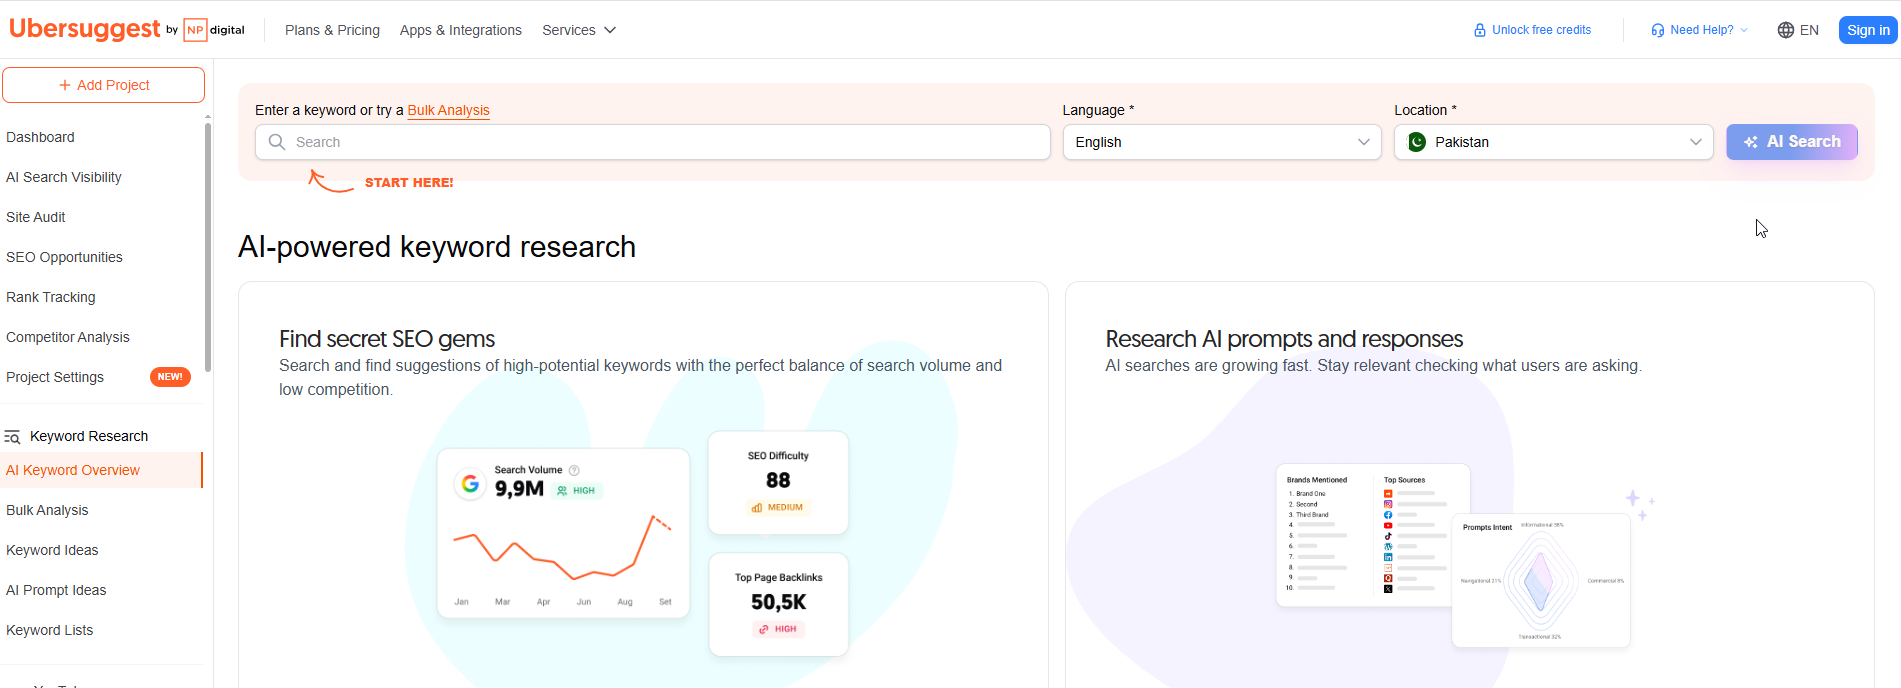
Ubersuggest is Neil Patel's SEO and traffic analysis tool. It provides domain traffic overviews, keyword suggestions, content ideas, backlink data, and a basic site audit. It's designed to be simpler and more affordable than Ahrefs or Semrush, targeting small businesses and solo marketers who need essential SEO data without the enterprise complexity.
Why teams use it?
Teams use Ubersuggest when they need basic keyword research and traffic estimation at a price point well below enterprise SEO suites. It's particularly popular with solo founders, freelancers, and small businesses who can't justify $100+/month for Ahrefs or Semrush but still need competitive intelligence.
Who is this tool for (ICP)?
- Solo founders and bootstrapped startups.
- Freelance marketers and content writers.
- Small businesses doing DIY SEO.
- Beginners learning SEO fundamentals.
How this tool fits in this AI-first era?
Ubersuggest uses AI for content idea suggestions and writing assistance. Its simplicity makes it easy to plug outputs into AI workflows — export keyword lists, feed them into content briefs, and use AI writing tools to draft. It's a lightweight starting point for teams not ready for enterprise-grade tooling.
Free tier?
Yes — limited free searches per day. Paid plans start low.
Strengths?
- Very affordable entry point for SEO data.
- Clean, beginner-friendly interface.
- Lifetime deal option (one-time payment).
Weaknesses?
- Significantly smaller database than Ahrefs or Semrush.
- Traffic estimates less accurate for niche sites.
- Fewer advanced features (no custom crawling, limited API).
Key Capabilities?
- Domain traffic overview and top pages.
- Keyword research and suggestions.
- Backlink analysis (basic).
- Site audit with SEO recommendations.
Pricing snapshot?
- Individual: ~$29/month.
- Business: ~$49/month.
- Enterprise: ~$99/month.
- Lifetime plans available (one-time payment).
Best for?
Best for small businesses and beginners who need SEO and traffic data but aren't ready for a $150+/month tool. Think of it as the on-ramp — once you outgrow it, you graduate to Ahrefs or Semrush.
Rating
Best Website Traffic Analysis Tool Stacks by Business Type
Instead of installing “everything,” choose a stack that fits your business.
For SaaS & Product-Led Companies
Recommended stack:
- GA4 (or Matomo) – core web analytics and acquisition
- Mixpanel / Amplitude – product & funnel analytics
- Hotjar / Clarity – behavior insights on onboarding & key flows
- Search Console – organic search performance
This combo gives you:
- Where users come from
- What they do before signup
- How they behave after signup
- Where they drop off in your product
For eCommerce & DTC Brands
Recommended stack:
- GA4 – web & ecommerce tracking (add enhanced ecommerce)
- Hotjar / Clarity – checkout and product page behavior
- Search Console – SEO & category page performance
- Optional: an SEO suite (Ahrefs/Semrush) for keyword and competitor research
Focus on:
- Product page performance
- Cart → checkout → purchase funnel
- ROAS and channel profitability
For Content & Media Sites
Recommended stack:
- GA4 or Plausible/Fathom – traffic and engagement
- Search Console – search queries and content opportunities
- Hotjar / Clarity – scroll depth, content engagement, UX
- Optional: SEO suite for content planning
You’ll prioritize:
- Which articles drive signups, subscribers, or ad revenue
- Topic clusters that perform best
- UX on mobile and long-form content pages
For Agencies Managing Multiple Clients
Recommended stack:
- GA4 across all clients (or Matomo for privacy-sensitive ones)
- Clarity / Hotjar for UX and CRO projects
- Ahrefs / Semrush / Similarweb for competitive analysis & reporting
- Looker Studio / reporting tools to centralize dashboards
As an agency, you need:
- Repeatable, standardized reporting
- Easy visibility into multiple domains
- Tools that help you justify decisions and results to clients
This is exactly where an agency like The Rank Masters can create leverage by:
- Choosing the right stack for each client
- Standardizing events, goals, and UTM structures
- Building client-readable dashboards that tell clear stories
Why Website Traffic Analysis Tools Actually Matter (Beyond “More Visits”)
Most teams say they want “more traffic.”
But traffic only matters if you can translate it into:
- Signups
- Demo requests
- Purchases
- Pipeline and revenue
That’s exactly what a smart, ROI-focused stack (think a ROI-first SEO tool stack for SaaS plus the Best SEO reporting software) helps you do: connect visitors to outcomes.
From “traffic” to revenue: Why raw visits aren’t enough
Looking only at sessions or pageviews is like judging a movie just by ticket sales, not by whether people stayed, enjoyed it, or recommended it.
You need to know:
- Which channels send your best-quality visitors
- Which pages actually lead to conversions
- Where users drop off in your funnels
- Which campaigns drive profitable traffic, not just volume
▶️ With the right tool stack and CRO support like dedicated CRO for product-led content, you can spot leaks and fix them before you pour more budget into acquisition.
What good tools help you see
The right tools help you answer questions like:
- “Which blog posts actually lead to signups?”
- “Is my paid traffic from Google Ads profitable?”
- “Why is organic traffic growing but conversions flat?”
They do this by tracking:
- Acquisition (source/medium, campaigns, channels)
- Behavior (pageviews, time on page, scroll depth, events)
- Conversion (goals, eCommerce revenue, signups, key actions)
- Retention (return visitors, cohorts, user journeys)
Who needs these tools most
Useful for:
- SaaS & product-led companies – need funnels, activation, and retention insight; pairing a SaaS SEO agency with CRO for product-led content helps turn traffic into signups and expansion.
- eCommerce & DTC brands – need ROAS, checkout tracking, and LTV visibility to know which campaigns genuinely pay off.
- Content & media sites – rely on engagement, subscribers, and ad/partner revenue; strong SaaS content marketing services plus analytics show which articles actually move the needle.
- Agencies – need multi-site tracking and reporting across clients to prove ROI and prioritize what to work on next.
How to Choose the Right Traffic Analysis Tool for Your Business
Choosing a tool isn’t about “what’s popular” – it’s about what fits your model and how you make money. Before you start trialing every platform under the sun, get clear on a few basics.
Step 1 – Get clear on your business & needs
Ask yourself:
- What is my business model? (SaaS, eCom, content, local, marketplace, etc.)
- If you’re SaaS, a specialist SaaS SEO agency can help you pick tools that reflect trials, MRR and expansion, not just clicks.
- Do I need basic reporting or deep analysis?
- Simple lead-gen site? Basic analytics + heatmaps might be enough.
- Product-led SaaS or complex funnels? You’ll want event-level and product analytics.
- Am I okay with a free but complex tool, or do I want something simple but paid?
- GA4 can be powerful but confusing. Paid tools can be easier for non-technical teams.
If you’re not sure where to start, this is exactly what TRM’s ROI-first SEO tool stack for SaaS guide is built for.
Step 2 – Key features to look for
When you compare tools, prioritize features that actually help you make decisions:
- Real-time or near real-time tracking – useful for launches, campaigns, and troubleshooting.
- Clear dashboards non-technical people can read – your CMO and founders shouldn’t need a data degree.
- Conversion & funnel tracking – critical if you plan to invest in CRO for product-led content or want to fix leaks in signup/checkout flows.
- Integrations with CRM, ad platforms, email tools, and product analytics – so you can connect traffic to pipeline and revenue.
- Segmentation – slice users by source, device, country, content type, etc. to see what actually performs.
- Exporting & reporting – CSV, Sheets, dashboards, or dedicated tools. For ongoing reporting, pairing analytics with the Best SEO reporting software makes weekly and monthly updates much easier.
- Privacy & compliance – GDPR, cookieless, data residency if you’re in stricter jurisdictions.
Step 3 – Free vs paid: when “free” stops being enough
Free tools like GA4 and Search Console are often enough if:
- You’re just starting out
- Your funnel is simple (e.g., brochure site + contact form)
- You’re okay with a steeper learning curve
Paid tools start to make sense when:
- You want simple, opinionated dashboards your whole team actually uses
- You need advanced funnels, cohorts, heatmaps, and session recordings
- You want more reliable data and better support as privacy changes and ad blockers evolve
If you’re on the fence, have a look at the ROI-first SEO tool stack for SaaS to see where free vs paid tools fit into a lean but powerful setup.
Step 4 – Can (and should) you use multiple tools?
Yes, and you probably should.
Most serious teams run a stack of 2–4 tools, for example:
- One core analytics tool – GA4 or a privacy-first alternative
- One behavior analytics tool – heatmaps + recordings for CRO
- One SEO / traffic intelligence tool – for keyword & competitor insights
- Optional: product analytics – for in-app behavior and retention in SaaS
The key is making sure they work together, not fighting each other.
If you’d like someone to design that stack for you (instead of piecing it together by trial and error), you can Contact The Rank Masters to speak with our SEO strategists and walk away with a focused, no-fluff tool recommendation.
How to Track AI Search Traffic in 2026
In 2026, "traffic source" no longer means just organic, paid, social, email, and referral. AI search engines — ChatGPT, Perplexity, Google's AI Overviews, Gemini, and Microsoft Copilot — are sending real visitors to websites. And most analytics setups aren't tracking them properly.
If your GA4 reports show a growing "direct" traffic segment you can't explain, part of it is likely AI referral traffic being misclassified.
Here's how to set up proper AI traffic tracking with tools you're probably already using:
1. Check GA4 for AI referral sources
In GA4, go to Reports → Acquisition → Traffic Acquisition and filter by source/medium. Look for referral sources like:
- chat.openai.com (ChatGPT web browsing)
- perplexity.ai
- copilot.microsoft.com
- gemini.google.com
If you're seeing these, you're already getting AI traffic. If you're not, it may be landing in "direct" or "(not set)" because many AI tools don't pass referrer headers consistently.
2. Use Bing Webmaster Tools for AI index visibility
Since Bing's index powers ChatGPT and Microsoft Copilot, your Bing Webmaster Tools data is now a proxy for AI search visibility. Monitor your Bing impressions and clicks — growth here often correlates with being cited in AI answers.
3. Set up a custom GA4 channel group for AI traffic
Create a custom channel grouping in GA4 that buckets AI referrers together:
- Channel name: AI Search
- Conditions: Source matches chat.openai.com, perplexity.ai, copilot.microsoft.com, gemini.google.com, or any other AI referrer you spot
This gives you a dedicated "AI Search" line in your channel reports so you can track the trend separately.
4. Monitor Google AI Overviews impact in GSC
Google's AI Overviews don't show as a separate source in GSC, but you can infer their impact:
- Watch for keywords where impressions stay high but CTR drops significantly — this often means an AI Overview is answering the query above your result.
- Track "position 1" queries where clicks are declining. AI Overviews typically compress CTR for informational queries more than transactional ones.
5. Use dedicated AI visibility tools
For deeper AI tracking, tools like Semrush's AI Visibility Toolkit, Otterly.ai, or Peec AI now monitor how your brand appears across LLM-generated answers. These are still maturing, but they give you data you can't get from GA4 or GSC alone.
The bottom line: Treating AI traffic as a distinct channel — not lumping it into "direct" — is what separates modern analytics setups from legacy ones. If your stack doesn't track it yet, you're blind to a growing slice of how people actually find you.
How to Actually Use These Tools (Without Drowning in Data)
Installing tools is the easy part. Using them well is where most teams fail.
Step 1 – Set up clean tracking (goals, events, conversions)
- Define what a conversion is for you: signup, lead, purchase, booked call
- Set up goals/events in GA4 (or equivalent)
- Tag campaigns properly with UTMs so you know what’s working
👉 If your content and analytics are already messy, this is where a targeted SaaS content audit & fix sprint can clean up pages, tracking, and internal linking in one focused pass.
Step 2 – Build 2–3 “decision dashboards,” not 20 reports
Ask yourself:
“What decisions do we need to make regularly?”
Then build dashboards around those, for example:
- Acquisition dashboard – channels, campaigns, cost per acquisition
- Conversion dashboard – funnels, landing page performance
- Retention/product dashboard – usage, churn, cohort behavior
👉 Your dashboards should give you the same clarity you’d get from a good ROI-first SEO tool stack for SaaS and best-in-class Best SEO reporting software – clear, comparable numbers that drive action, not screenshots.
Step 3 – Turn insights into experiments
Data is useless unless it leads to action.
Turn findings into experiments like:
- “Landing page A has 30% higher conversion – let’s test messaging from A across other pages.”
- “Organic traffic to these blog posts is high but conversion is low – add CTAs, lead magnets, or internal links.”
👉 If your blog is a big acquisition lever, pairing analytics with CRO for product-led content helps turn those insights into structured experiments and bigger lifts in signups and demos.
Step 4 – Review on a fixed cadence
- Weekly: top channels, conversion trends, any anomalies
- Monthly: bigger patterns, content performance, SEO trends
- Quarterly: strategy-level insights, double-down decisions
👉 This is also where simple, readable reports from the right Best SEO reporting software keep your team and stakeholders aligned without manual number-crunching.
When to Bring in an Expert (and What an Agency Like The Rank Masters Actually Does)
At some point, DIY analytics hits a ceiling.
Signs you’ve outgrown DIY analytics
- You have traffic and leads, but can’t connect analytics to revenue
- Stakeholders ask questions you can’t answer from your current reports
- You keep jumping between tools and screenshots without clear decisions
- Your GA4 or tracking setup feels like a mess of random events
👉 That’s usually the moment to involve a specialist SaaS SEO agency instead of spending yet another quarter “fixing dashboards.”
What a specialized SEO & content agency does with your traffic data
An experienced agency doesn’t just “install” tools, they:
- Audit your current analytics stack
- Clean up events, goals, and UTM structure
- Connect traffic data to business outcomes (pipeline, MRR, LTV)
- Use traffic insights to prioritize:
- Content topics
- Landing pages
- SEO campaigns
- CRO experiments
How The Rank Masters can help
On a site like The Rank Masters, this is exactly how you position the team:
You can say something like:
At The Rank Masters, we don’t treat analytics as an afterthought.
We help brands:
- Choose the right traffic analysis stack for their stage and model
- Set up clean, trustworthy tracking across tools
- Build dashboards that your marketing, sales, and product teams actually use
- Turn traffic insights into SEO, content, and CRO roadmaps that drive pipeline
▶️ If you’d like us to review your current setup and show you where you’re leaving growth on the table, you can Contact The Rank Masters to request a free website traffic analysis audit and walk away with a clear, prioritized plan.
(You can adjust the offer: free audit, roadmap, consultation, etc.)
Frequently Asked Questions
What is the best free website traffic analysis tool?
Do I need both Google Analytics and a separate traffic checker?
What’s the difference between website analytics and SEO tools?
How accurate are website traffic estimation tools?
Can I track competitors’ website traffic?
How often should I review my website traffic reports?
Which tools are best for privacy-focused or GDPR-compliant tracking?
How do I track AI search traffic (ChatGPT, Perplexity) in Google Analytics?
What is the most accurate website traffic checker for competitors?
Can I do website traffic analysis without Google Analytics?
Final Thoughts
Choosing the “best” website traffic analysis tool isn’t about finding a magic platform—it’s about building the right stack for your stage, model, and team.
If you’d like help:
- Picking the right tools
- Cleaning up your current tracking
- Turning your traffic data into an actual growth plan
👉 This is exactly what a specialist B2B SaaS SEO Agency like The Rank Masters is built to do.
We combine analytics, SEO, content, and CRO through services like:
- SaaS SEO agency support to drive qualified, compounding organic traffic
- SaaS content marketing services that attract, educate, and convert your ideal buyers
- CRO for product-led content to turn high-intent visitors into signups, demos, and opportunities
👉 If you’re ready to stop guessing and start using your data to grow faster, Contact The Rank Masters and request a free website traffic analysis audit—so you can see exactly where you’re leaving growth on the table and what to fix first.
📑 Disclosure!
Some links in this article are affiliate links. If you sign up through them, The Rank Masters may earn a commission at no additional cost to you. This does not influence which tools we recommend or what we say about them.