
In 2026, the top three organic results captured 68.7% of every click on a Google search page, according to First Page Sage's click-through-rate meta-analysis, which means a page that technically ranks but ranks low is, in visibility terms, barely on the map.
That single number is why search visibility exists as a metric. Average position treats a jump from #50 to #40 as progress even though almost nobody will ever see it, and raw traffic tells you what happened without telling you how much of the available demand you actually captured.
Search visibility fixes both blind spots by scoring how much of the total possible attention your tracked keywords earn, on a clean 0 to 100 scale, so you can tell in one glance whether your SEO is winning or slipping.
This guide explains what search visibility is, how the score is calculated, why it matters more (not less) in an AI-heavy 2026 SERP, and exactly how to measure and grow it inside Semrush using therankmasters.com as the live example. If you would rather have the whole system built and interpreted for you, The Rank Masters does that for B2B SaaS teams
▶️ If your ranked pages are not showing up in AI answers and you want a content system that fixes that, book a SaaS content strategy call.
Table of Contents
What Is Search Visibility?
Search visibility is a percentage score that estimates how much of the available organic click share your website earns across a set of tracked keywords. A score of 100% means you hold the number one position for every keyword you track, and 0% means you rank for none of them.
The metric is also called SEO visibility, organic search visibility, or a search visibility score, and most rank-tracking tools calculate their own version of it. What they share is a weighting model, namely each keyword ranking is scored by the click share that position typically earns, then those shares are combined into one figure. Semrush defines its own Visibility metric as a click-through-rate-based score that tracks a domain's progress across Google's top 100 for the keywords in a campaign.
The value of a single, bounded score is that it compresses hundreds of individual rankings into a number a founder or head of growth can actually act on. You do not need to read a spreadsheet of 400 keyword positions to know whether last quarter's content push worked. You watch one line move.
A few defining attributes make the metric useful:
- Bounded and intuitive: the score runs from 0% to 100%, so it reads like a progress bar rather than an abstract rank you have to interpret.
- Position-weighted, not position-averaged: moving a keyword from page ten to page six barely moves the score, while moving it from position four to position two moves it a lot, because that is where the clicks actually are.
- Keyword-set specific: the score only means something relative to the keywords you chose to track, so two sites are only comparable when they track the same terms.
- Trendable: because it is one number, you can chart it daily and tie every rise or dip to a specific content, technical, or algorithm event.
If any of these terms are new, the SEO glossary covers the vocabulary, and the full explainer on the SEO visibility score goes deeper on the math.
Search Visibility vs Keyword Rankings vs Traffic: What Is the Difference?
Search visibility, keyword rankings, and organic traffic answer three different questions, and confusing them is the most common reporting mistake in SEO. Rankings tell you where a single page sits, traffic tells you how many visits you got, and visibility tells you how much of the winnable attention you are capturing across your whole keyword set.
Here is the practical difference. You can hold steady rankings and still lose traffic, because the SERP around you changed. You can grow traffic and still be losing visibility, because a competitor is growing faster. Visibility is the only one of the three that measures your share of the opportunity rather than a raw count.
| Metric | What it answers | Best used for | Blind spot |
|---|---|---|---|
| Keyword ranking | Where does this one page rank for this one term? | Diagnosing a specific page or query | your |
| Average position | What is the mean rank across all my keywords? | A rough directional trend | Treats a #1 and a #100 as averaging to #50, hiding reality |
| Organic traffic | How many visits did I get? | Measuring outcomes and revenue | Says what happened, not how much you left on the table |
| Search visibility | What share of available clicks am I capturing? | Tracking overall SEO health and share of demand | Only comparable within the same tracked keyword set |
Semrush itself notes that comparing two sites on Visibility rather than average position gives a more accurate read, because a site holding one first-place ranking and one hundredth-place ranking is far more visible than a site sitting at position fifty for both, even though their average position is identical.
That is the whole case for the metric in one example. For a fuller treatment, see our breakdown of keyword rankings versus traffic.
How Is a Search Visibility Score Calculated?
A search visibility score is calculated by taking each keyword you rank for, multiplying its position by the click-through rate that position typically earns, and expressing the total as a percentage of the maximum possible if you ranked first for everything. The click-through-rate weighting is what makes the metric realistic.
The reason position weighting matters so much is that clicks are wildly front-loaded on the SERP.
First Page Sage's 2026 data puts the number one organic result at a 39.8% click-through rate, position two at 18.7%, and position five at just 5.1%, so the drop-off from top spot to mid-page is steep and non-linear.
| Organic position | Typical CTR (2026) | Share of a #1 result's clicks |
|---|---|---|
| Share of a #1 result's clicks | 39.8% | 100% |
| 2 | 18.7% | 47% |
| 3 | 10.2% | 26% |
| 4 | 7.2% | 18% |
| 5 | 5.1% | 13% |
| 6 to 10 | 4.4% down to 1.6% | 11% to 4% |
Read that table as a weighting curve and the score makes intuitive sense. A keyword sitting at position two contributes only about 47% of what it would at position one, and by position five it contributes barely an eighth.
This is why Semrush calculates its visibility metric by weighting every tracked ranking against its average click-through rate, so each position change has a realistic impact on the score rather than an equal one.
Two nuances are worth holding onto. First, any keyword where you do not rank in the top 100 is scored as if you sit at position 100, so a large set of unranked terms drags the score down. Second, a related metric called Share of Voice weights the same rankings by each keyword's search volume, so a single high-volume term can matter more than a dozen tiny ones. We will come back to Share of Voice in the metrics section.
Why Does Search Visibility Matter for B2B SaaS in 2026?
Search visibility matters more in 2026 than it did five years ago because the SERP now gives away answers for free, so the fight is no longer for clicks alone, it is for presence at the top of a page most people never scroll or click. Being visible is the precondition for everything downstream, namely traffic, citations, and brand recall.
The backdrop is stark. SparkToro's clickstream analysis with Similarweb found that 68.01% of US Google searches ended without a click in the first four months of 2026, up from 60.45% in 2024 and roughly 45% a decade ago.
At the same time, AI Overviews now appear on about 30% of US desktop keywords as of late 2025, up from just 10% earlier that year, pushing the traditional blue links further down the page.
| Search-behavior signal | Figure | Source and year |
|---|---|---|
| US Google searches ending without a click | 68.01% | SparkToro / Similarweb, 2026 |
| Zero-click rate a decade earlier | ~45% | SparkToro historical, 2016 |
| US desktop keywords showing an AI Overview | ~30% | seoClarity, Sept 2025 |
| AI Overview sources drawn from the top 10 results | >99% | seoClarity, 2025 |
| Position one CTR change year over year | down 32% | GrowthSRC, 2025 |
Here is the part that surprises people. Rankings can hold perfectly steady while traffic falls off, because an AI Overview or a featured snippet absorbed the click before the user ever reached your link.
GrowthSRC's study of more than 200,000 keywords found position one click-through rates fell roughly 32% year over year into 2025, largely attributed to AI Overviews, even where rankings were stable. If you only track rankings, that decline is invisible to you until revenue notices it first.
None of this means SEO is dead, and it is worth quoting someone who has tracked this longer than almost anyone. As SparkToro's Rand Fishkin put it, "your SEO still matters as much or more than ever before, it just won't earn you traffic the way it once did." That is the reframe this whole article rests on. Visibility, measured as share of a crowded SERP, is now the leading indicator, and clicks are the lagging one. The teams that win are the ones optimizing for presence across snippets, AI Overviews, and the top organic spots, which is the heart of answer engine optimization and the reason we treat zero-click search as a strategy problem, not a reason to give up.
What Metrics Make Up Search Visibility?
Search visibility is best understood as a small family of related metrics rather than a single number, and each one answers a slightly different question about your presence. Reading them together is what turns a score into a decision.
The five that matter most in a rank tracker like Semrush are the visibility percentage, estimated traffic, average position, Share of Voice, and SERP feature presence. The Position Tracking overview lets you toggle the main graph between the first three, adds Share of Voice on the Business tier, and flags which of your keywords trigger SERP features.
| Metric | What it tells you | When to lead with it |
|---|---|---|
| Visibility % | Your CTR-weighted share of possible clicks across tracked keywords | Your single highest-level health check |
| Estimated Traffic | Projected daily visits from current positions | Tying visibility to a business outcome |
| Average Position | Mean rank across all tracked keywords | A quick directional read, treated cautiously |
| Share of Voice | Visibility weighted by each keyword's search volume | When high-volume terms matter more than keyword count |
| SERP Features | Which keywords show snippets, People Also Ask, or AI Overviews | Understanding why rankings and clicks diverge |
The distinction between Visibility % and Share of Voice trips up a lot of people, so it is worth being precise. If you rank first for ten tiny keywords and nowhere for one enormous one, your Visibility % can look high while your Share of Voice stays low, because Share of Voice weights by actual search demand. Visibility answers am I ranking well for my list? and Share of Voice answers am I capturing the searches that actually happen? You want both, and we go deeper on the second one in our note on share of voice in SEO.
How to Check Your Search Visibility for Free First
You can get a rough read on your search visibility for free using Google Search Console, which reports the raw ingredients of the metric even though it does not compute a single score for you. It is the honest starting point before any paid tool.
Google's own documentation defines the four Performance metrics you need, namely impressions, clicks, click-through rate, and average position. Impressions tell you how often a link to your site appeared, average position is the impression-weighted rank of your topmost result, and click-through rate is clicks divided by impressions. Together they let you spot pages that are visible (high impressions) but not earning clicks, which is exactly where visibility work pays off.
The catch is that Search Console gives you the inputs, not the weighted output. It will not tell you your share of possible clicks across a defined keyword set, it will not benchmark you against competitors, and its average position averages away the reality that a single page can rank third for one query and thirtieth for another. That gap between raw metrics and an interpreted score is where a dedicated tool earns its place.
| Capability | Google Search Console (free) | Semrush Position Tracking (paid) |
|---|---|---|
| Impressions, clicks, CTR, average position | Yes | Yes |
| Single weighted visibility score (0 to 100%) | No | Yes |
| Competitor visibility benchmarking | No | Yes |
| Daily tracking with SERP feature and AI Overview flags | Limited | Yes |
| Curated keyword-set tracking with tags | No | Yes |
For most B2B SaaS teams the free tools are enough to confirm there is a problem, and a rank tracker is what you use to size it, benchmark it, and fix it. The rest of this guide runs inside Semrush.
How to Set Up Position Tracking and Find Your Visibility Score in Semrush
The fastest way to get a real visibility score is to create a Position Tracking campaign for your domain and read the Visibility % on the overview. On therankmasters.com this is the first number we check every morning.
Here is the exact path:
- Open Semrush and click Projects in the left navigation, then create or open the project for your domain.
- Select Position Tracking from the project tools.
- Set your target country and device to match your real audience rather than where you are based.
- Add the keywords you want to track, ideally your commercial and high-intent terms first.
- Add up to four competitor domains so your score has context from day one.
- Open the Overview report and read the Visibility % at the top of the trend graph.
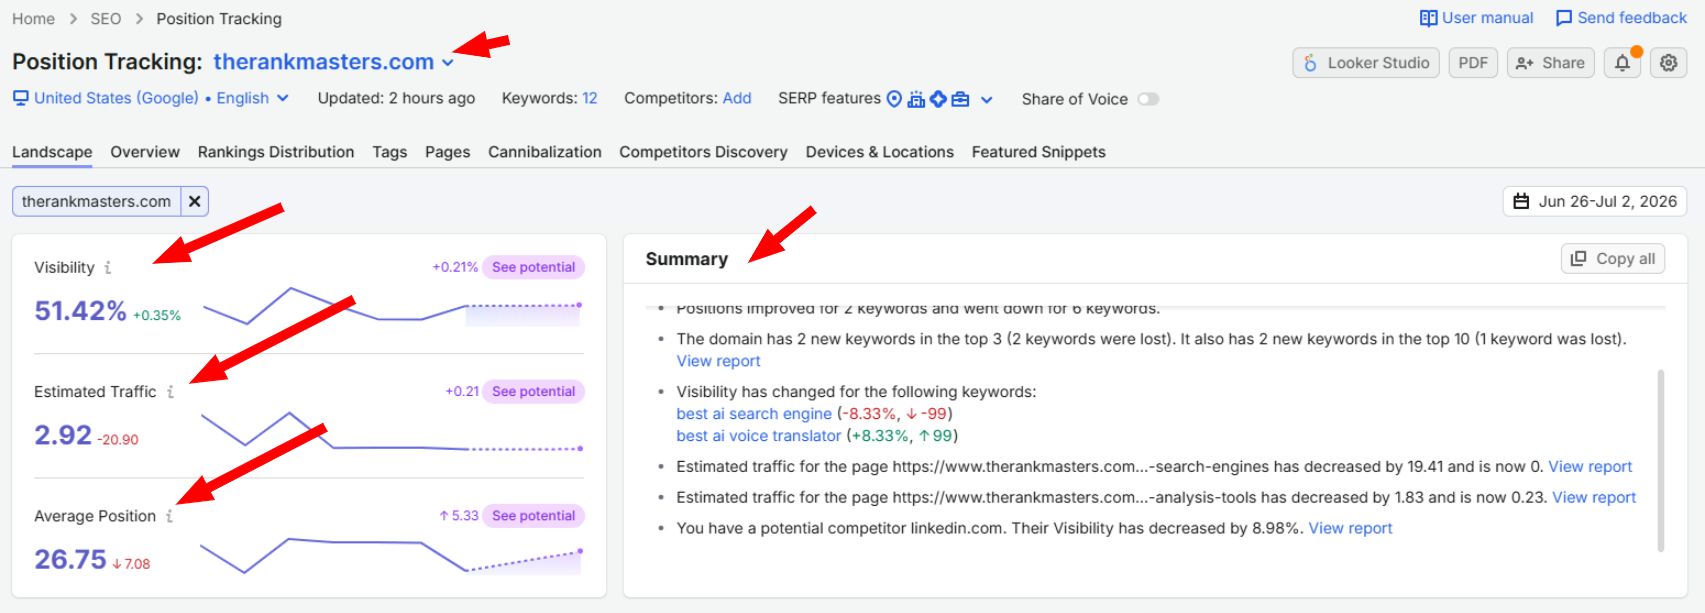
Read the number in context, not in isolation. A Visibility % of, say, 12% is neither good nor bad until you see it next to your competitors and your own trend, because the score only means something relative to the keyword set you chose.
What you are looking for on day one is a believable baseline you can improve, not a vanity figure. If your number looks strangely low, check that your keyword list is not padded with terms you have no real chance of ranking for, since every unranked keyword is scored as position 100 and drags the average down.
Want to follow along on your own domain? Start a 14-day Semrush One trial and pull your baseline visibility score before the next step.
How to Read Your Visibility Trend Over Time in Semrush
The trend line is more valuable than the score itself, because a visibility number only becomes actionable once you can see it moving and tie each move to something you did. A flat snapshot tells you where you are, but the trend tells you whether you are winning.
Here is how to work the trend:
- In the Position Tracking Overview, find the main trend graph.
- Set the date range to cover the period you want to review, for example the last ninety days.
- Toggle the graph headers to switch between Visibility %, Estimated Traffic, and Average Position.
- Use the Notes feature to mark content launches, technical fixes, or known Google updates.
- Correlate each rise or dip in the line with the note beside it.
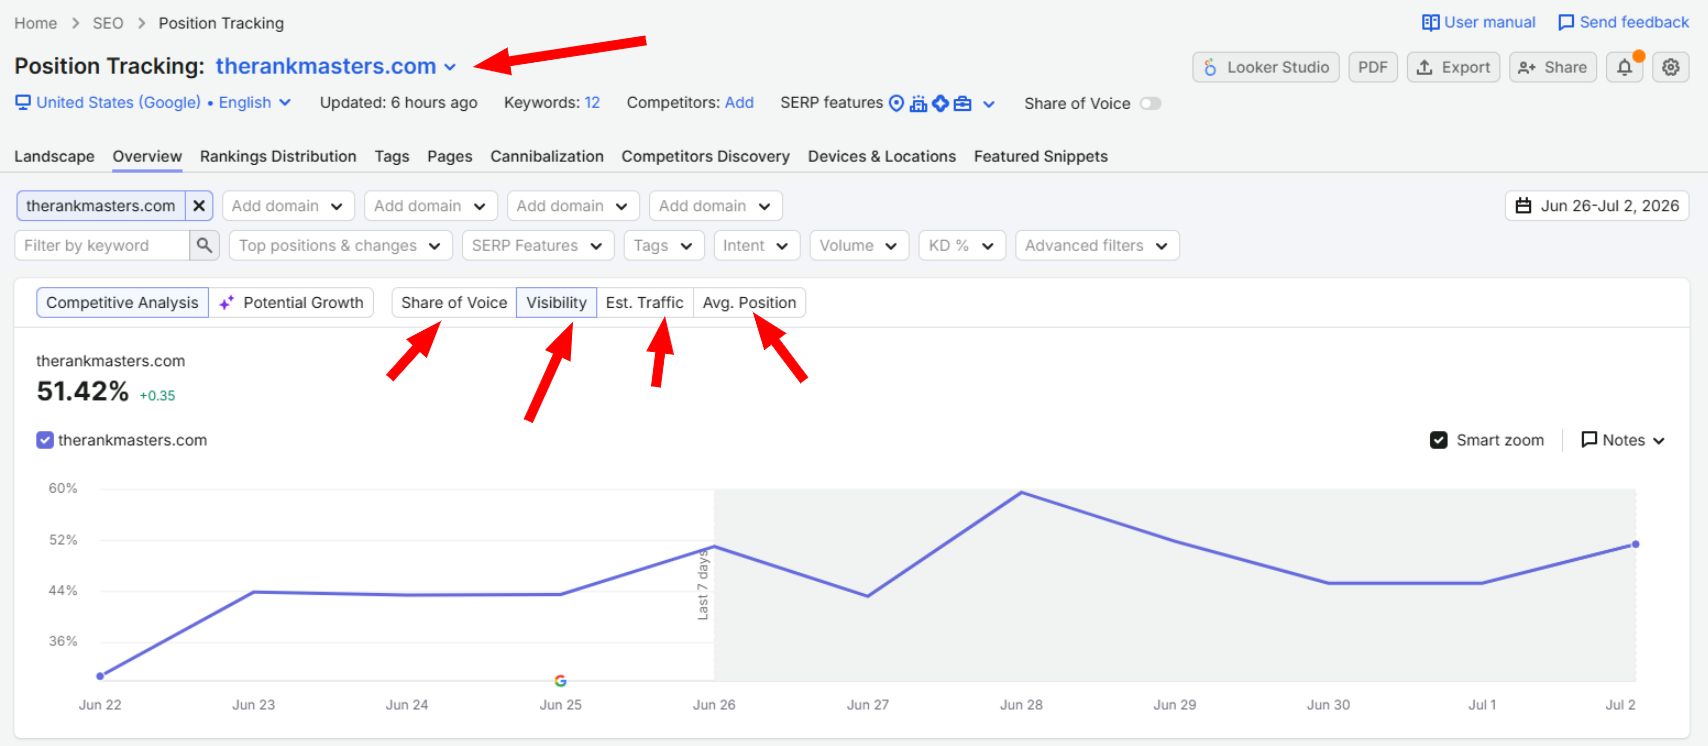
A healthy trend climbs steadily or holds while the keyword set expands. A worrying trend shows a sharp cliff, which usually points to either a Google algorithm update or a technical problem, or a slow bleed, which usually means a competitor is out-publishing you. The notes you add turn the graph into a cause-and-effect record, and Semrush also drops automatic notes when keywords are added or removed so you do not misread a self-inflicted dip as a ranking loss.
Follow along live: Open Semrush One on a 14-day trial and chart your own visibility trend against a known event.
How to Find the Keywords and Pages Driving Your Visibility in Semrush
Your visibility score is an average of many rankings, so the real work is finding which keywords and pages are pushing it up and which are dragging it down. The Landscape report is built for exactly this.
Walk it like this:
- Open the Landscape report inside your Position Tracking campaign.
- Read the Top Keywords widget to see where you already rank highest.
- Check Positive Impact for the keywords improving the most in your chosen date range.
- Check Negative Impact for the keywords declining the most, since those are your leaks.
- Open the Rankings report and filter to positions four through fifteen to find your quick wins.
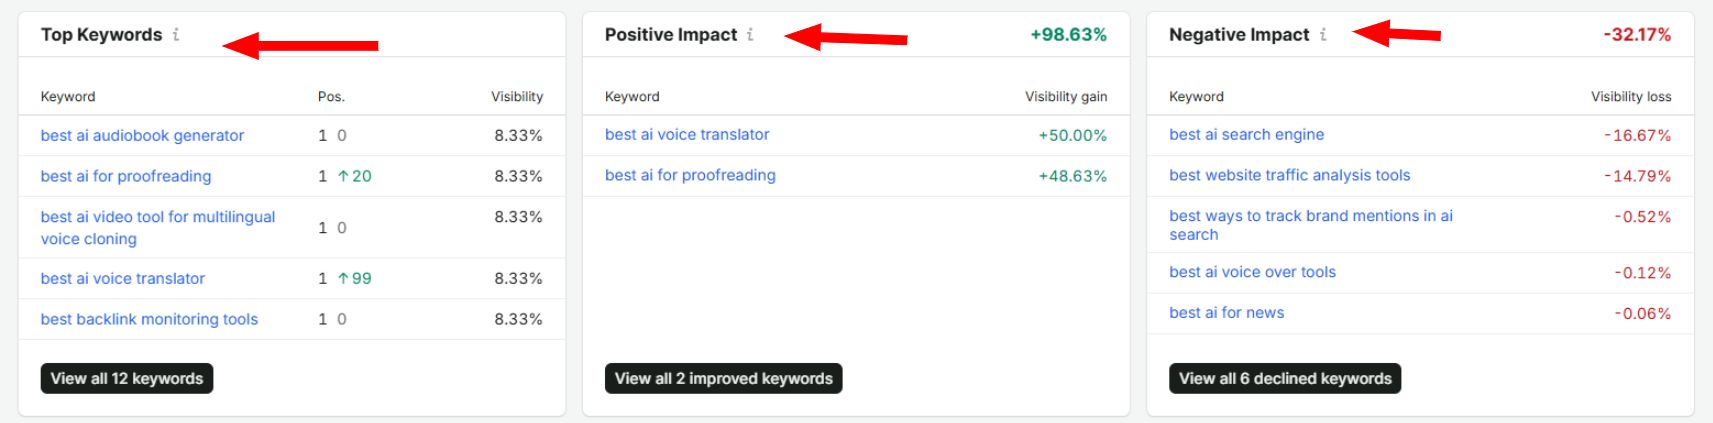
The positions-four-through-fifteen band is where visibility is won cheapest, because a page there is close enough to page one that a focused content or internal-linking improvement can move it up several spots, and the click-through-rate curve means each spot gained near the top is worth far more than one gained on page three. These are often called striking-distance keywords, and prioritizing them is the highest-return move on most sites. When you see two of your own URLs competing for the same term, that is keyword cannibalization, and consolidating them usually lifts visibility on its own.
See this on your own site. Try Position Tracking free for 14 days and sort your keywords by impact.
How to Compare Your Search Visibility Against Competitors in Semrush
A visibility score only becomes meaningful next to your competitors, because 15% might be market-leading in one niche and near-invisible in another. Benchmarking is what converts a raw number into a target.
Set the comparison up like this:
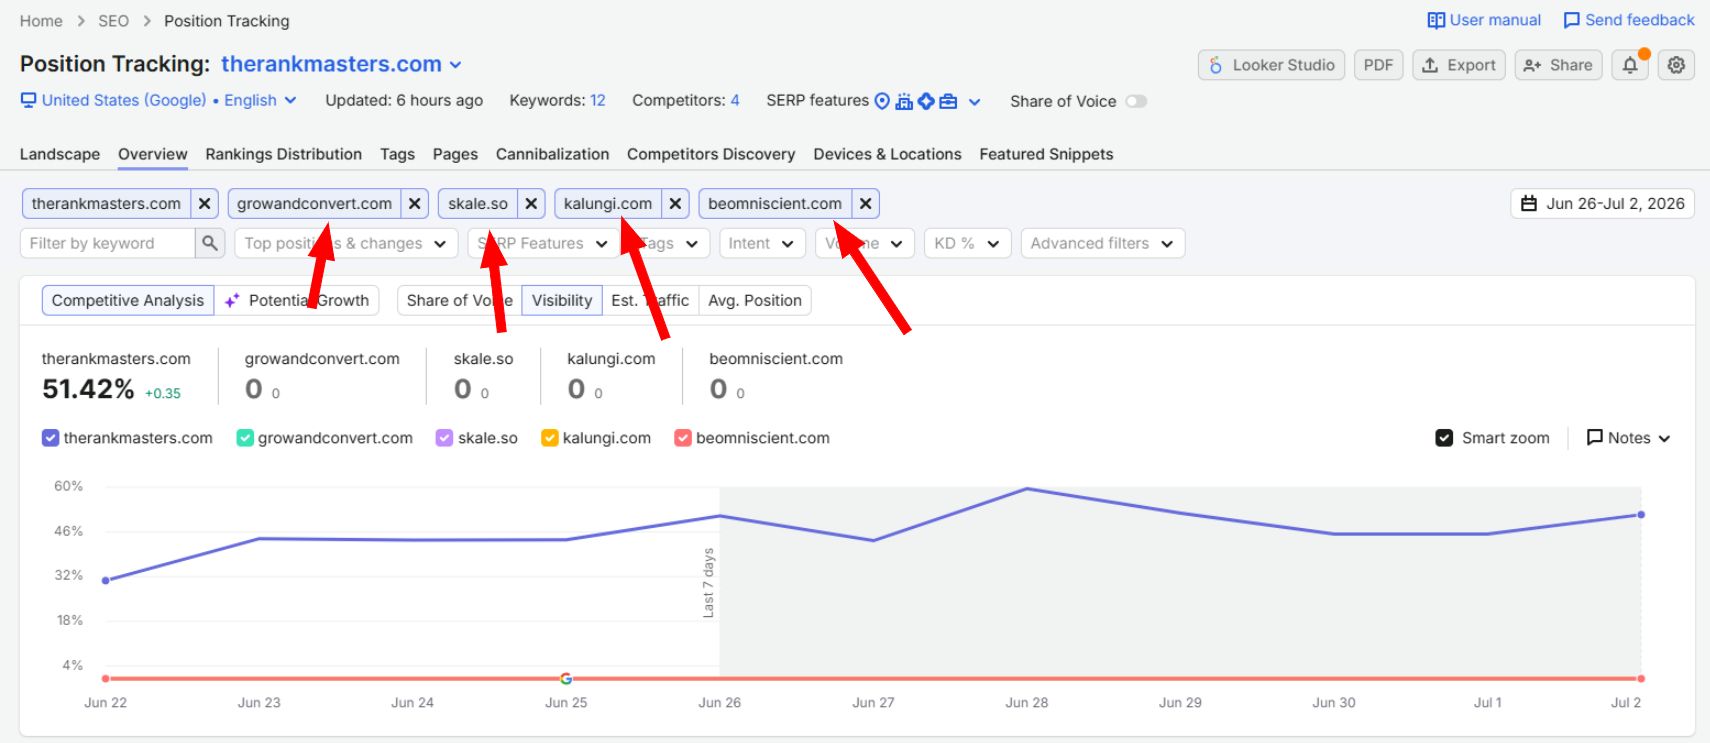
- In your Position Tracking campaign, add the competitor domains you want to benchmark against.
- Return to the Overview and read every domain's Visibility % on the same graph.
- Switch the main site selector to a competitor to see the SERP from their side.
- In the Landscape report, use the top-pages view to find which competitor pages you most need to worry about.
- Note the keywords where a competitor outranks you but sits in your striking-distance band.
| Benchmark read | What it means | The move it drives |
|---|---|---|
| You lead and the gap is widening | Your content system is compounding | Defend your top pages, expand the cluster |
| You trail by a small margin | You are one focused push from parity | Attack striking-distance keywords where they lead |
| You trail by a wide margin | A structural content or authority gap exists | Build the missing topic clusters, not one-off posts |
This is the exact point where a tool stops and a strategist starts. A dashboard like this one will hand you the numbers, namely your score, your competitor gaps, and the pages losing ground. It will not tell you which of them to act on first, or how to turn them into a plan. That interpretation layer, reading the metrics and mapping your ICP's buying journey to the SEO and answer-engine content that wins it, is the work The Rank Masters does for B2B SaaS teams.
Spin up your own comparison. Run this report on a 14-day Semrush One trial and see where you sit against your rivals.
How SERP Features and AI Overviews Change Your Visibility
SERP features like featured snippets, People Also Ask, and AI Overviews change your effective visibility even when your ranking does not move, because they absorb attention and clicks before the user reaches the classic blue links. Tracking them is now part of measuring visibility, not a side quest.
The scale of the effect is real. First Page Sage's data shows a featured snippet, which sits above the number one result, can pull a 42.9% click-through rate, and seoClarity found that more than 99% of AI Overview citations are drawn from the top 10 organic results. Read those two facts together and the strategy writes itself, namely you still need strong organic rankings to be eligible for the feature, and then you need to structure content to win the feature itself.
Here is how to track feature presence in Semrush:
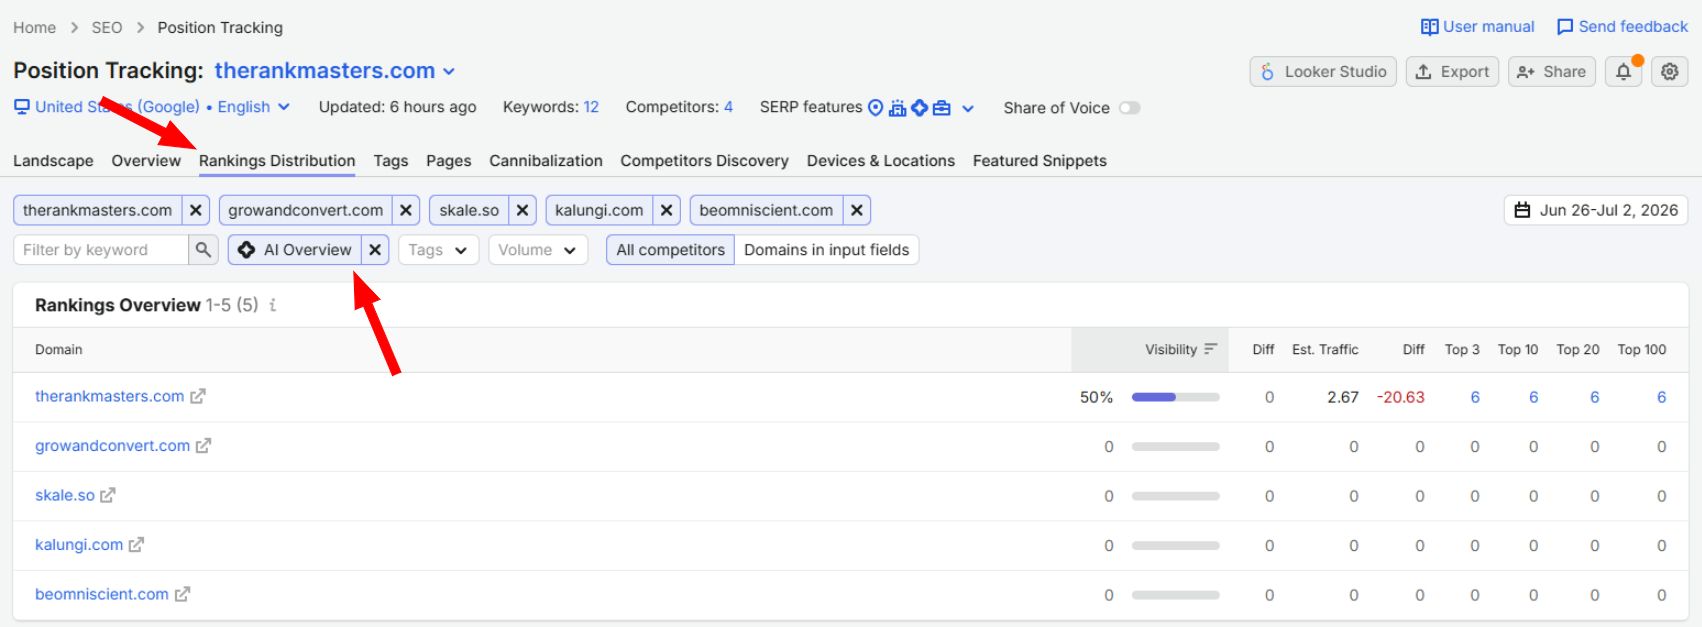
- Open the Rankings report inside Position Tracking.
- Filter by SERP features to see which of your keywords trigger them.
- Open the Featured Snippets tab to find snippet opportunities you can target.
- Watch for the AI Overview and other feature flags that Position Tracking identifies for your keywords.
- Prioritize keywords where you rank on page one but a feature is taking the click.
| SERP element | Effect on your visibility | The optimization it rewards |
|---|---|---|
| Featured snippet | Can take the top click even from a #2 or #3 ranking | Concise, structured answers near the top of the page |
| People Also Ask | Adds visibility for question variants you may not rank for | FAQ and question-led content blocks |
| AI Overview | Compresses clicks but still cites top-ranked, well-structured pages | Passage-level clarity and strong organic rankings |
Because AI Overviews draw almost entirely from top-ranked pages, the work of earning organic visibility and the work of earning AI citations are now the same work done well. That is why we treat classic SEO and AI search visibility as one connected practice rather than two teams.
Get the same view for your keywords. Follow along on a free 14-day Semrush One trial and find the features stealing your clicks.
How to Diagnose a Visibility Drop with Semrush Site Audit
When visibility falls and it is not an algorithm update, the cause is usually technical, and Site Audit is where you find it. A crawlability or indexation problem can quietly suppress rankings across dozens of pages at once, which shows up as a visibility dip long before you notice the missing traffic.
Run the diagnostic like this:
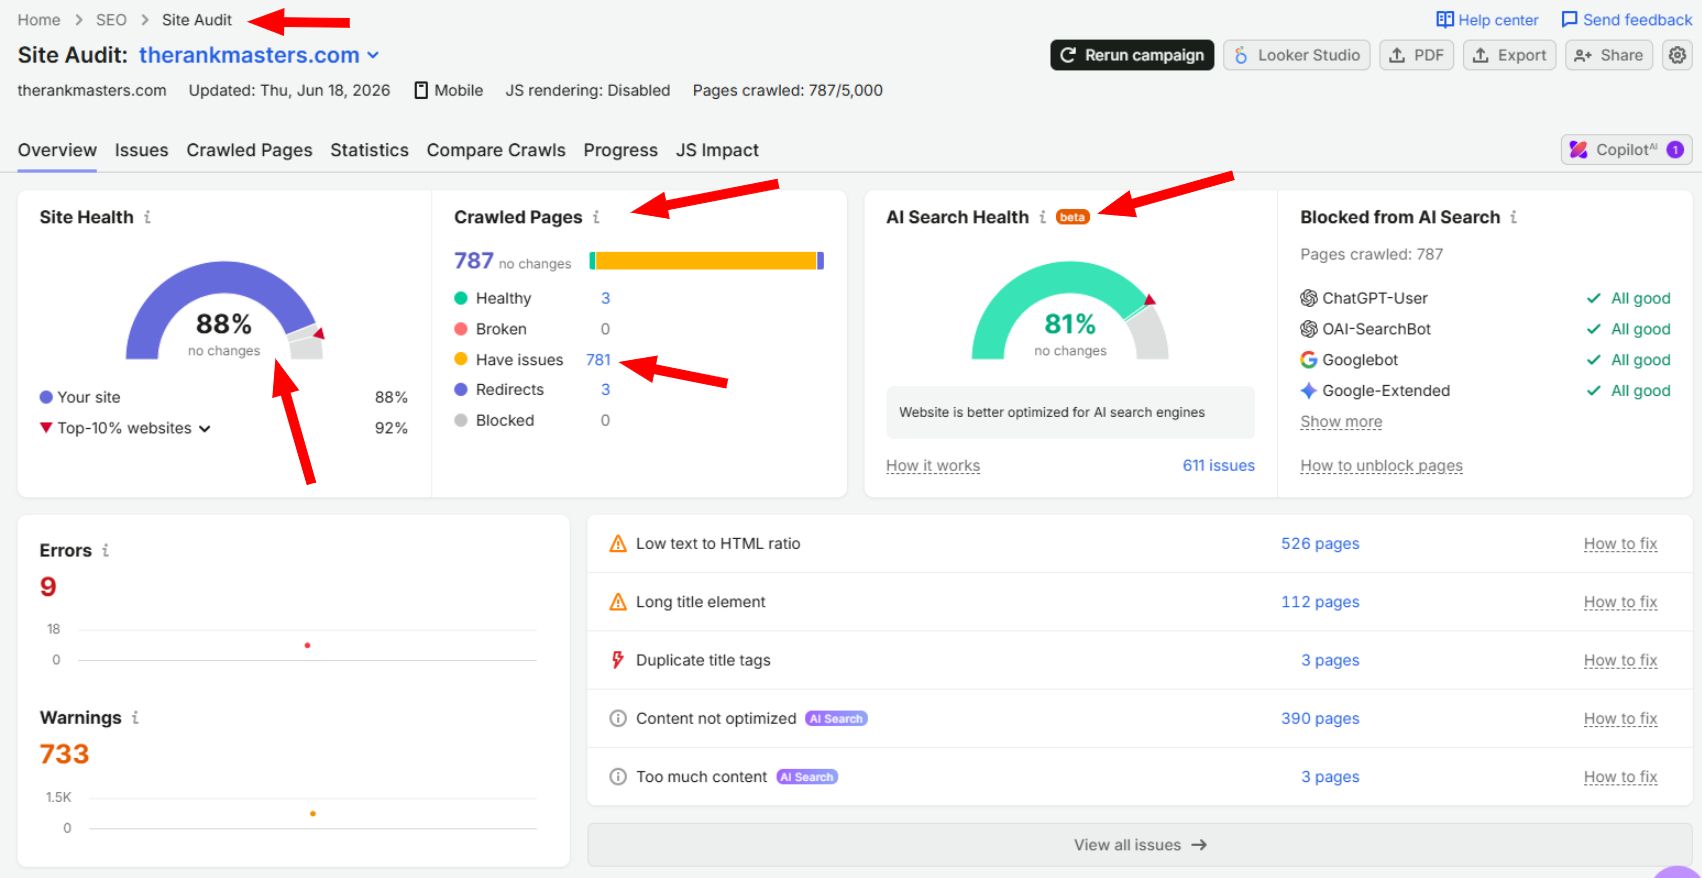
- Open Site Audit from your project and run or refresh the crawl.
- Read the Site Health score at the top of the overview.
- Sort issues by severity and start with Errors, then Warnings.
- Look specifically for crawlability and indexability flags, broken links, and slow pages.
- Fix the highest-severity issues first, then re-crawl and watch the visibility trend respond.
| Symptom in your data | Likely cause | Where to confirm it |
|---|---|---|
| Sudden visibility cliff across many pages | Algorithm update or sitewide technical issue | Position Tracking notes plus Site Audit errors |
| Slow visibility bleed on specific pages | Content decay or rising competition | Landscape Negative Impact |
| High impressions, falling clicks | A SERP feature or AI Overview absorbed the click | Rankings SERP feature filter |
| Pages dropping out of the index entirely | Crawlability or indexation error | Site Audit crawlability checks |
The discipline that separates a recovery from a guess is a clean cause-and-effect record. Before you rewrite a single page, confirm whether the drop is technical, competitive, or algorithmic, because the fix for each is completely different. Our site audit checklist and our note on crawlability and indexation walk through the fixes in order.
Diagnose your own dip. Start your own 14-day Semrush One trial and run a full Site Audit before you touch a page.
How to Improve Your Search Visibility Step by Step
You improve search visibility by moving your near-page-one keywords up, winning the SERP features on your terms, deepening topical coverage, and clearing the technical issues that suppress rankings. In that order, because the earliest steps return the most visibility for the least effort.
Work the levers in sequence:
- Prioritize positions four through twelve. These striking-distance keywords are closest to the steep part of the click curve, so a small ranking gain here buys the most visibility. Semrush's own analysis notes that a one-position gain in the 2-to-12 band can meaningfully lift traffic.
- Win the SERP features. Structure your best pages to earn featured snippets and to be citation-ready for AI Overviews, since features now take the click that a raw ranking used to.
- Deepen topical authority. Cover the full question cluster around each money topic rather than publishing isolated posts, so you rank for the long tail as well as the head term.
- Fix the technical drag. Clear crawlability, indexation, and speed issues in Site Audit so your content is eligible to rank in the first place.
- Consolidate cannibalizing pages. Merge competing URLs so one strong page earns the ranking instead of two weak ones splitting it.
- Build internal links to your target pages. Point contextual internal links at the pages you want to move, using topic-named anchors, to channel authority where you need it.
Executing this well is exactly the gap The Rank Masters closes for B2B SaaS teams, building an ICP-led content system that maps each topic cluster to a money page and to pipeline, rather than publishing posts that never convert.
The difference between a visibility score that drifts and one that compounds is almost always whether the work is prioritized against revenue or just against rankings. If you want proof of what that looks like in practice, our case studies show the pattern.
A realistic cadence is a weekly check of the trend and the impact widgets, and a monthly deeper pass on striking-distance keywords, features, and technical health. Chasing the score daily is noise, ignoring it for a quarter is negligence, and the organic CTR curve is the reason the near-top keywords always come first.
What Is a Good Search Visibility Score?
A good search visibility score is one that beats your direct competitors for the same keyword set and trends upward over time, because there is no universal number that counts as good. The score is only meaningful relative to your keyword list and your market.
The reason there is no absolute benchmark is that the metric depends entirely on which keywords you chose to track. A site tracking ten easy branded terms might sit near 90%, while a site tracking a thousand competitive commercial terms might lead its market at 20%. Neither number means anything until you see it against rivals and against last quarter.
| If your visibility is | And the trend is | Read it as |
|---|---|---|
| Below your top competitor | Rising | On the right track, keep closing the gap |
| Below your top competitor | Flat or falling | A strategy problem, not a tactics problem |
| Above your competitors | Rising or steady | Market-leading, shift to defending and expanding |
| Anywhere | Volatile week to week | Normal noise, judge on the monthly trend |
The practical rule is to set your own benchmark from your competitors' scores, then measure progress against your own baseline rather than a number you read in a blog post. Visibility is a race against named rivals, not against an abstract ideal.
How Much Do Search Visibility Tools Cost?
Search visibility tracking ranges from free to enterprise pricing, and for most B2B SaaS teams a mid-tier all-in-one plan covers everything in this guide. The free option gives you the raw metrics, and a paid rank tracker gives you the weighted score, competitor benchmarking, and daily SERP-feature data.
As of mid-2026, verify current terms, the tiers break down roughly like this. Google Search Console is free and reports impressions, clicks, click-through rate, and average position, but computes no single visibility score. Semrush bundles Position Tracking, Organic Research, and Site Audit inside its plans, with Share of Voice available on the Business tier, and offers a 14-day Semrush One trial through the partner link in this article so you can run everything before you pay.
| Option | Rough cost (mid-2026, verify current terms) | What you get |
|---|---|---|
| Google Search Console | Free | Raw impressions, clicks, CTR, average position |
| Semrush One trial | Free for 14 days via the partner link | Full Position Tracking, Organic Research, Site Audit |
| Semrush paid plans | Tiered monthly, verify current pricing | Ongoing tracking, competitor benchmarking, Share of Voice on higher tiers |
The honest framing is that the tool is the cheap part. The expensive part, and the part that actually moves the score, is the strategy and content work that acts on what the tool shows. That is worth remembering before you compare subscription prices, and it is why teams often route the tooling budget through a trial and put the real investment into execution.
Frequently Asked Questions
Search visibility in SEO is a 0 to 100% score that estimates how much of the available organic click share your site captures across a set of tracked keywords. A 100% score means you rank first for every tracked term, and the metric weights each ranking by the clicks that position typically earns.
No. A keyword ranking is the position of one page for one term, while search visibility aggregates all your rankings into a single click-weighted score. You can hold steady rankings and still lose visibility if competitors improve or if SERP features absorb the clicks your positions used to earn.
It is calculated by scoring each tracked keyword by its position's typical click-through rate, then expressing the total as a percentage of the maximum if you ranked first for everything. Keywords outside the top 100 are scored as position 100, and volume-weighted variants like Share of Voice weight by search demand instead.
A good SEO visibility score is one that beats your direct competitors on the same keyword set and trends upward, since there is no universal target. The score depends entirely on which keywords you track, so a leading site in a competitive niche may sit far below a hobby site tracking easy terms.
You can approximate it in Google Search Console, which reports impressions, clicks, click-through rate, and average position for your site at no cost. It will not compute a single weighted score or benchmark you against competitors, so most teams use it to confirm a problem and a rank tracker to size and fix it.
Your visibility can fall while rankings hold because a SERP feature or AI Overview absorbed the click before users reached your link. In 2026 more than two-thirds of US Google searches ended without any click, so tracking feature presence and click-through rate matters as much as tracking position.
Striking-distance keywords in positions four through twelve can move within four to eight weeks of focused content and internal-linking work, while building topical authority for competitive head terms usually takes several months. Technical fixes in Site Audit can lift suppressed pages faster once the crawl issue is cleared.
Track the Number That Actually Predicts Your Pipeline
Search visibility is the earliest signal you have that your SEO is winning or slipping, and in an AI-heavy 2026 SERP it is a better leading indicator than either rankings or raw traffic. Measuring it is a few clicks in Semrush. Turning the score into a plan that maps to revenue is the harder part.
If thin coverage of your highest-intent topics is costing you pipeline, book a SaaS content strategy call and we will map your best-converting topics to a visibility plan that compounds.
And if you want to run the tracking yourself first, spin up a free 14-day Semrush One trial and pull your baseline visibility score before your next planning meeting.